
Figures & data
Figure 1. Geographical location and map of Shenzhen in Guangdong Province, South China; (a) Location of Shenzhen in China; (b) Location of Shenzhen in Guangdong province; (c) Districts in Shenzhen.
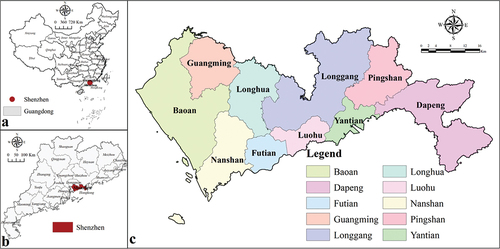
Table 1. Datasets used in this study.
Table 2. Descriptions and counts of POIs categories for Shenzhen, 2020.
Figure 2. The framework for identifying industrial parcels and evaluating their efficiencies.
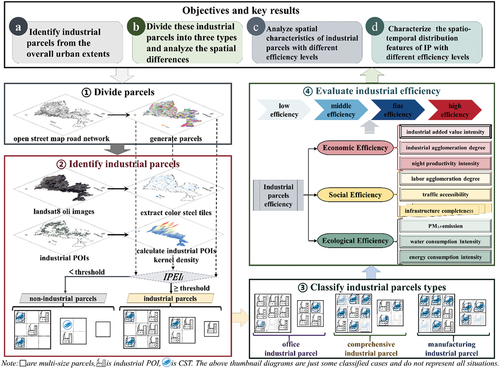
Figure 3. Spectral reflectance curves of different surface objects.
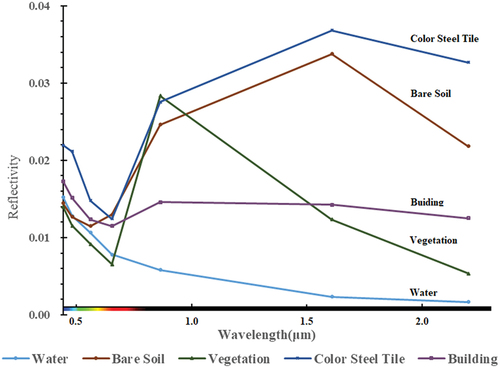
Figure 4. The subdivision of three types of industrial parcels.
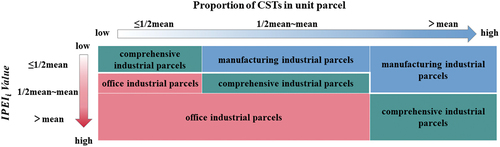
Table 3. The typical features and image references of three types of industrial parcels.
Table 4. The evaluation index system of industrial efficiency.
Figure 5. The spatial distribution of industrial parcels in Shenzhen. (a). Industrial parcels at parcel scale; (b). Industrial parcel numbers with districts as the statistical unit.
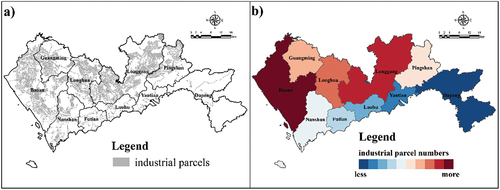
Figure 6. The Four-quadrant evaluation of different types of industrial parcels. (OIPs, CIPs and MIPs represent office, comprehensive and manufacturing IPs, respectively. LH, LG, GM, DP, FT, PS, BA, YT, LHu and NS represent Longhua district, Longgang district, Guangming district, Dapeng district, Futian district, Pingshan district, Baoan district, Yantian district, Longhu district, and Nanshan district).
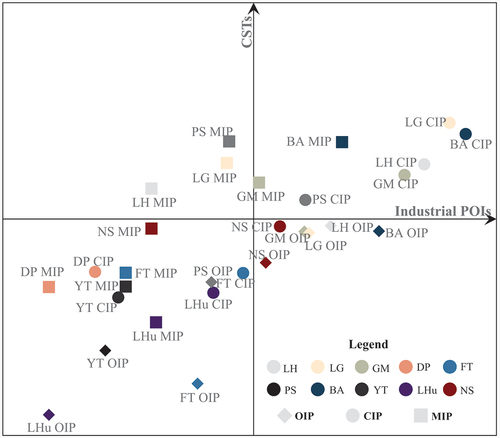
Figure 7. The spatial distribution of three different types of industrial parcels. (a) shown as point, (b) shown as parcel, (c) shown as district (parcel numbers), and (d) shown as district (parcel areas).
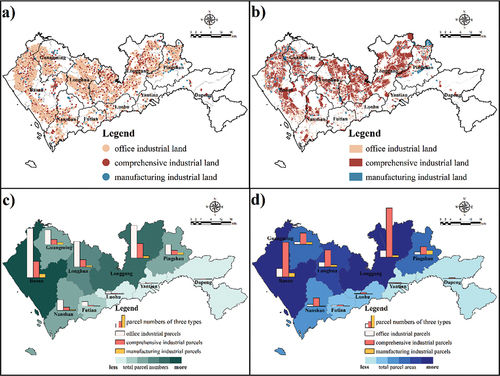
Figure 8. Industrial parcels efficiency evaluation and cluster analysis results. (a) Shown as point, (b) Shown as parcel, (c) Shown as district (parcel number).
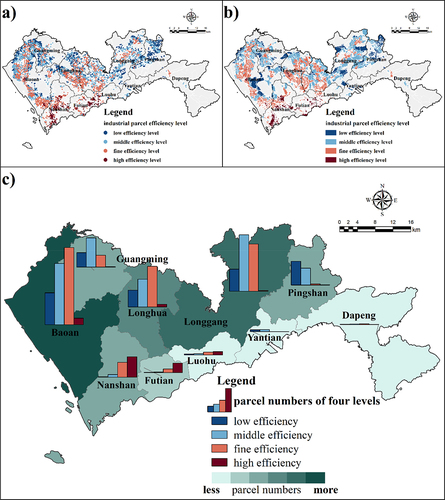
Figure 9. Evolution characteristics of four efficiency types among four levels.
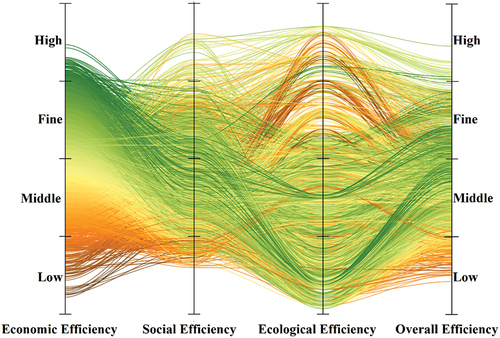
Figure 10. The alluvial diagram of the efficiency hierarchy of various types of industrial parcels.
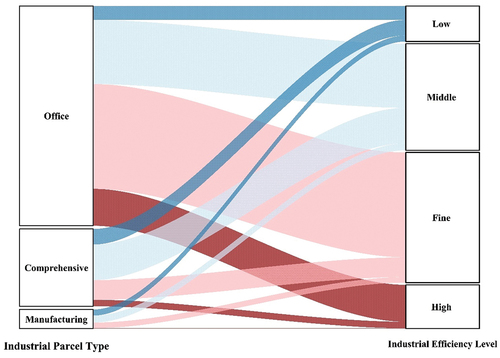
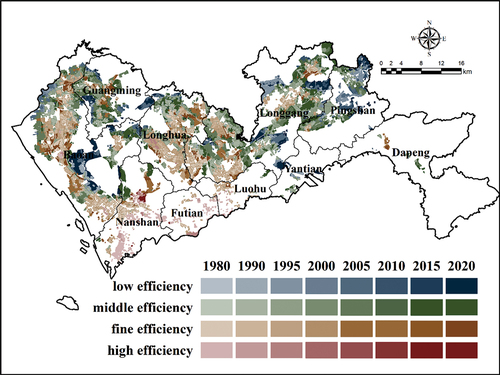
Figure 11. The establishment years of industrial parcels of four efficiency levels.
Supplemental Material
Download MS Word (12.7 MB)Data availability statement
The data that support the findings of this study are freely available in the OpenStreetMap Foundation (https://download.geofabrik.de/asia/china.html), Amap Services (https://www.amap.com/), National Aeronautics and Space Administration (https://search.earthdata.nasa.gov/), WorldPop Mainland China dataset (https://www.worldpop.org/), ChinaHighPM2.5 dataset (https://weijing-rs.github.io/product.html), National Bureau of Statistics of China (http://www.stats.gov.cn/), China Land Use/Land Cover Change (CNLUCC) (http://www.resdc.cn/DOI, 2018. DOI:10.12078/2018070201).