Figures & data
Figure 1. Geographic location of Beijing, Wuhan, and the Pearl River Delta in 2000.
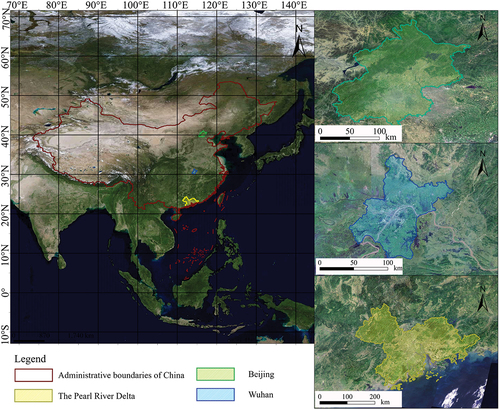
Table 1. Details and generalization of each spatial variable.
Figure 2. Methodological framework.
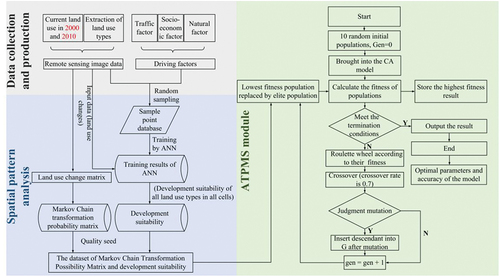
Figure 3. The architecture of the artificial neural network.
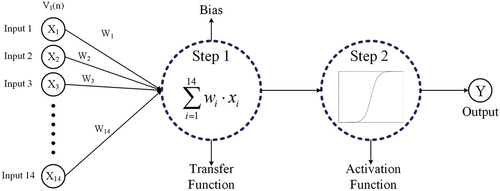
Figure 4. Spatial distribution of land transfer in the three study areas during the calibration and validation periods. Numbers 1–6 represent cropland, forest, grassland, water area, built-up land and unused land. Code “12” represents the transfer of cropland to forest, et cetera.
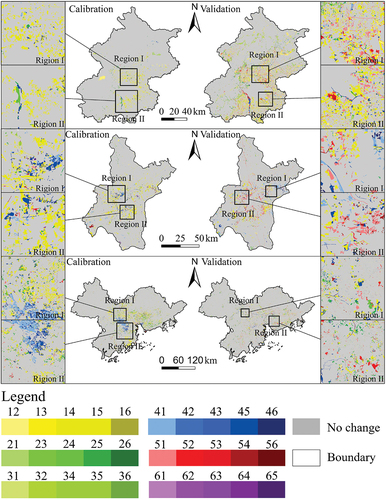
Table 2. Transition matrix for land use type transition (km2) in Beijing, Wuhan, and the Pearl Delta River, 2000–2010.
Table 3. Transition probability matrix (%) in Beijing, Wuhan, and the Pearl Delta River, 2000–2010.
Figure 5. Accurate modeling results of the adaptive transition probability matrix with quality seeds for transition probability optimization are presented for Beijing (a), Wuhan (b), and the Pearl River Delta (c) during the period 2000–2010.
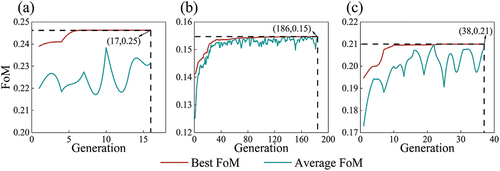
Table 4. Optimized transition probability matrix (%) in Beijing, Wuhan, and the PRD, 2000–2010.
Table 5. Validation coefficients for three different the cellular automata models in Beijing, Wuhan, and the PRD in calibration period.
Table 6. Validation coefficients for three different the cellular automata models in Beijing, Wuhan, and the PRD in validation period.
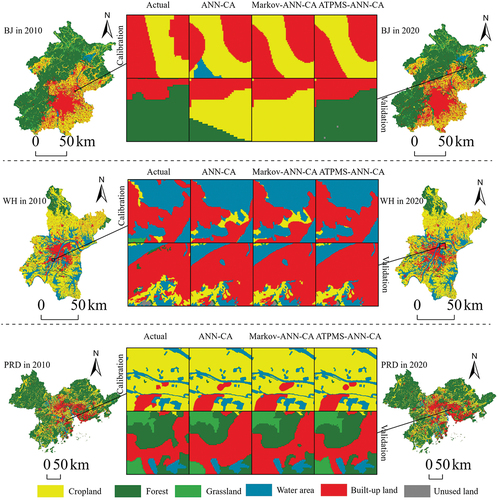
Figure 6. Comparative results of landscape details of current land use status in Beijing, Wuhan and the Pearl River Delta using artificial neural networks-cellular automata, Markov-artificial neural networks-cellular automata and adaptive transfer probability matrix-artificial neural networks-cellular automata models with quality seeds during the period of calibration (2000 to 2010) and validation (2010 to 2020).