
Figures & data
Figure 1. Historical trend of publications and overview of first author affiliation grouped by country and continent. Number of papers published are indicated in parentheses.
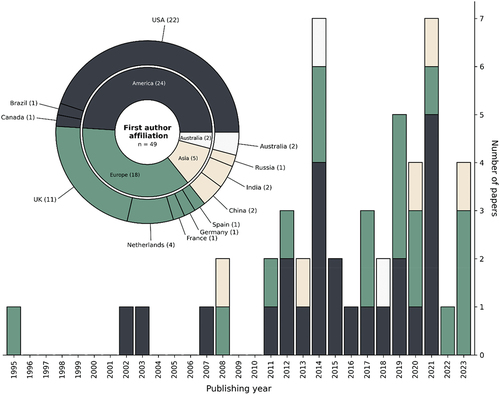
Figure 2. Spatial distribution and overview of the studied species and biomes. The location of study areas was determined using the information in the papers (i.e. geographical coordinates and/or use of the figures and places mentioned). The biomes were determined by selecting the most representative biome of each study area, using the IUCN global ecosystem typology (v2.1) maps (Keith et al. Citation2022). The numbers above each bar correspond to the number of published papers.
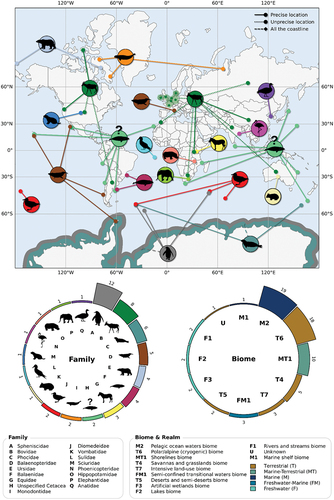
Figure 3. Overview of sensors used in the studies and the spatial and spectral resolutions of imagery used. The numbers next to or above each bar indicate the number of papers. ‘n/a’ means that the information was not available. Note that since some articles used several sensors with different spatial and/or spectral resolutions, the number indicated above the bars of the scatter plot does not necessarily correspond to the number of points.
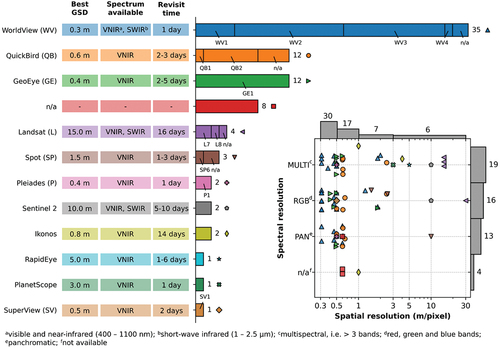
Table 1. Overview of methods used for detecting, counting and surveying wildlife on satellite imagery, and their description, validation methods and main limits as described in the 49 reviewed papers. Note that as visual interpretation was usually used to create ground truth, only papers using this method to produce detection, counting or survey results were considered.
Figure 4. Spatial representation of multiple wildlife species under varying environments and ground sampling distances, simulating various satellite spatial resolutions and their impact on image clarity, species identification and high-density individual distinction: (a) African buffalo (syncerus caffer), (b) topi (damaliscus lunatus jimela), (c) caribou (Rangifer tarandus), (d) harp seal (pagophilus groenlandicus), and (e) nests of great blue heron (Ardea Herodias). Note that ultra-high resolution aerial images (< 5cm) were artificially down-sampled to simulate these different satellite resolutions. Images of African buffalo and topi (a, b) are samples from the dataset of Delplanque et al. (Citation2022) with permission of the authors. Images of caribou, harp seal and great blue heron were shared by the Alaska Department of Fish and Game (c), fisheries and oceans Canada-québec (d), and the government of Quebec and CERFO (e).
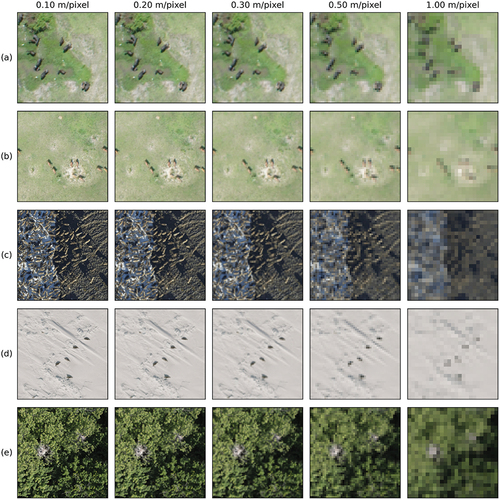
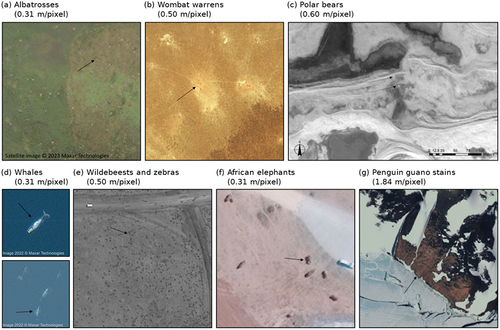
Figure 5. Examples of species studied using VHR satellite imagery: (a) Albatrosses (diomedea Exulans). Image from Bowler et al. (Citation2020), printed with permission from the authors, copyright (2023), maxar technologies. (b) Wombat (lasiorhinus latifrons) warrens. Figure reprinted from Swinbourne et al. (Citation2018), copyright (2018), with permission from Elsevier. (c) Polar bears (Ursus maritimus). Figure reprinted from LaRue et al. (Citation2015), copyright (2015), with permission from John Wiley and sons. (d) Right whale (Eubalaena australis) and gray whales (Eschrichtius robustus). Images from Cubaynes et al. (Citation2019), printed with permission from the authors, copyright (2022), maxar technologies. (e) Wildebeests (connochaetes taurinus) and zebras (equus quagga). Figure reprinted from Xue et al. (Citation2017), copyright (2017), maxar technologies. (f) African elephants (Loxodonta africana). Figure from Duporge et al. (Citation2021), copyright (2021), maxar technologies. (g) Penguin guano stains. Figure reprinted from Le et al. (Citation2022), copyright (2021), with permission from John Wiley and sons.
20240422_Delplanque_et_al_Revised_Manuscript_Clean_version.docx
Download MS Word (4.8 MB)Data availability statement
Data sharing is not applicable to this article as no new data were created or analyzed in this study.