
Figures & data
Figure 1. Land use in the study area and wildfire perimeters representing the burned area on Maui Island due to the recorded 2019–2023 events.
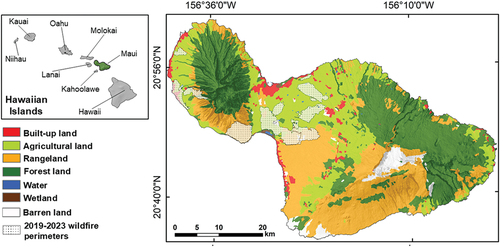
Figure 2. Diagram of the workflow for detecting wildfire locations and generating wildfire susceptibility maps.
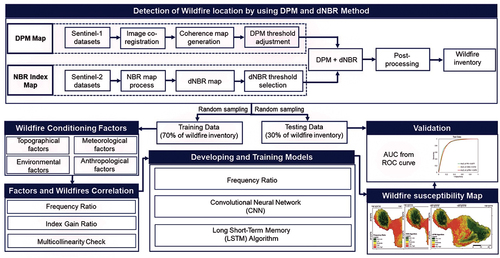
Table 1. Wildfire information and sentinel-1 data used to generate the DPM.
Table 2. Wildfire information and sentinel-2 data to produce the median NBR map.
Figure 3. Wildfire-related factors: (a) aspect, (b) slope, (c) TWI, (d) wind exposition index, (e) solar radiation, (f) wet canopy evaporation, (g) windspeed, (h) rainfall, (i) land use, (j) NBR, (k) NDVI, (l) distance to streams, (m) distance to roads, (n) distance to buildings, and (o) distance to fire stations.
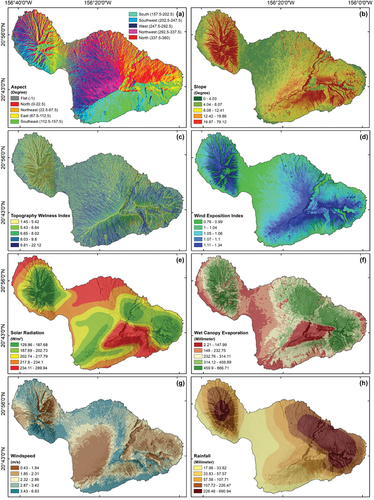
Figure 3. (Continued).
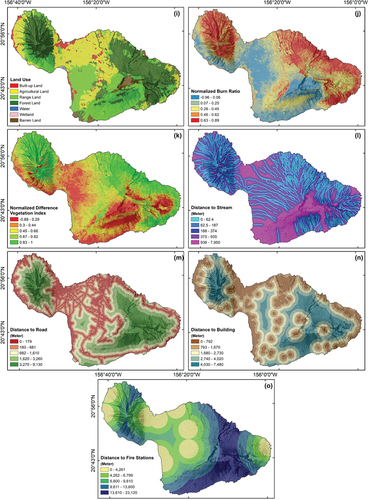
Table 3. Detailed information on the wildfire-related factors.
Table 4. Comparison of accuracy of each method used in generating wildfire inventories.
Figure 4. Wildfire inventory map generated by combining the DPM and dNBR methods using sentinel-1 and sentinel-2 data.
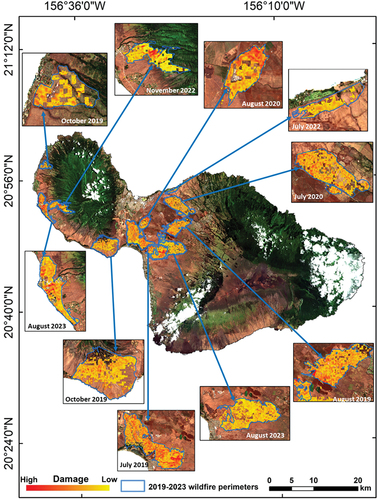
Table 5. The relative importance of the wildfire-related factors and multicollinearity analysis results using the IGR, TOL, and VIF metrics.
Table 6. Frequency ratio scores representing the relationship between wildfire occurrence and related factors.
Figure 5. Wildfire susceptibility maps of Maui Island, Hawaii, based on the (a) FR, (b) CNN, and (c) LSTM algorithms.
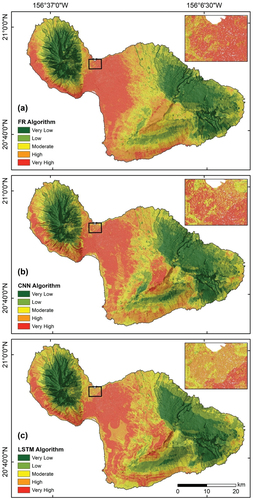
Figure 6. Comparison of the pixel percentages between the wildfire susceptibility classes produced by the FR, CNN, and LSTM.
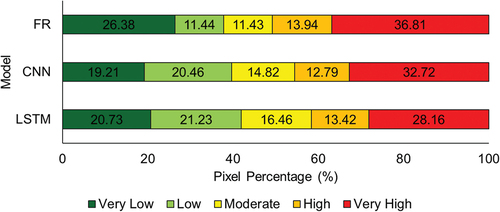
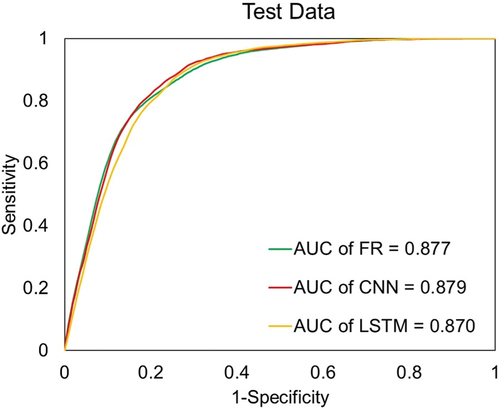
Figure 7. Validation of the FR, CNN, and LSTM models based on AUC of ROC curve analysis.
Data availability statement
The Sentinel-1 data that support the findings of this study are openly available in the NASA Earth Observation Data at https://search.asf.alaska.edu/. The DEM SRTM data is provided by the United States Geological Survey (USGS) at https://earthexplorer.usgs.gov/. The Sentinel-2 data was obtained from Google Earth Engine. The wildfire perimeters were digitized from PlanetScope images that are freely accessed at https://www.planet.com/for Education and Research Program members. The solar radiation, wet canopy evaporation, and windspeed data can be found at http://climate.geography.hawaii.edu/. Rainfall data is available at https://www.hawaii.edu/. Land use, stream, road, building, and fire station data are found at https://planning.hawaii.gov/.