
Figures & data
Figure 1. Map of training and testing sites in Germany.
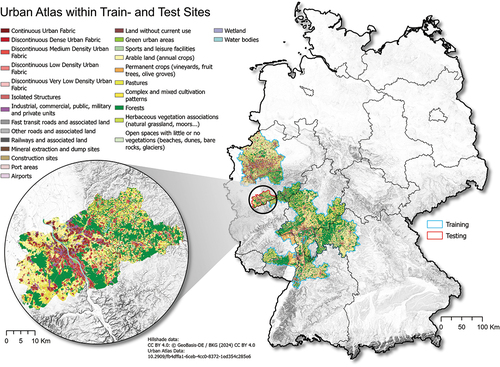
Figure 2. Distribution of class shares of land use and land cover in (a) training and (b) test area.
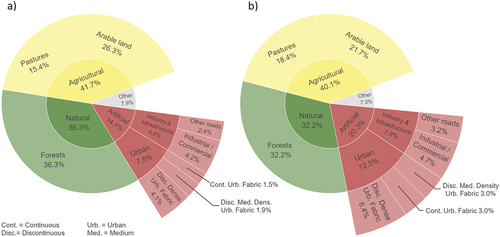
Table 1. Image statistics of S2 training images.
Figure 3. Difference between scaled and shifted reflectance values with and without a prior Yeo-Johnson transformation.
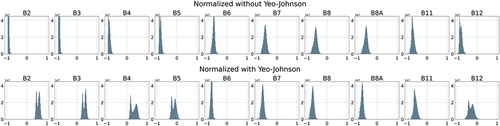
Figure 4. U-NET Architecture of the generator with downsampling and upsampling blocks and skip connections. In- and output dimensions are based on Training Set B input data. Kernel sizes are provided for convolutional layers.
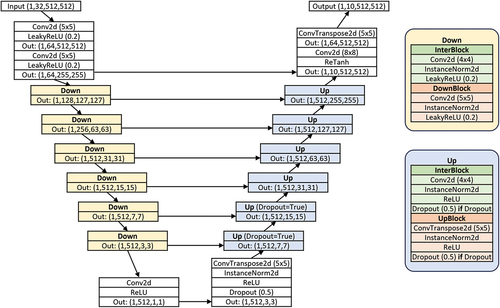
Figure 5. PatchGAN Architecture of the discriminator within the CGAN. In- and output dimensions are based on Training Set B input data. Kernel sizes are provided for convolutional layers.
Figure 6. Blending process of differently sized patches to a seamless large-scale image with the help of Euclidean distance masks.
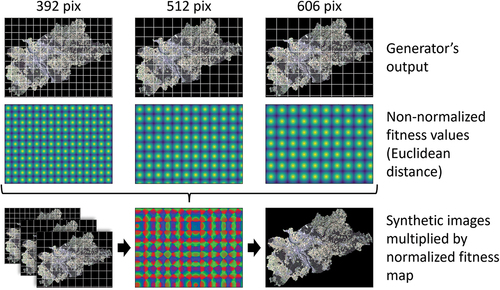
Table 2. Applied metrics to evaluate and compare the synthetic images generated by the two models.
Figure 7. Applied workflow for data preparation, training, model inference, and the evaluation of the resulting large-scale images. Dotted lines represent input paths of statistical parameters for data normalization and denormalization. Continuous lines represent image data paths.
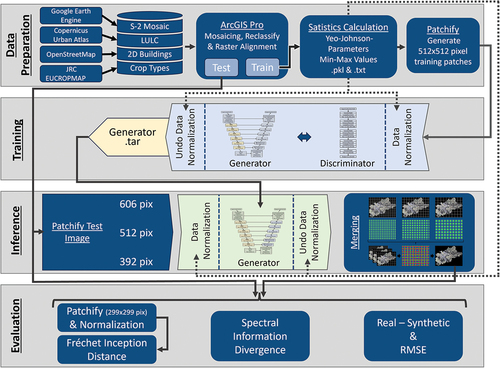
Figure 8. Comparison of resulting synthetic images and the real image under different spatial scales.
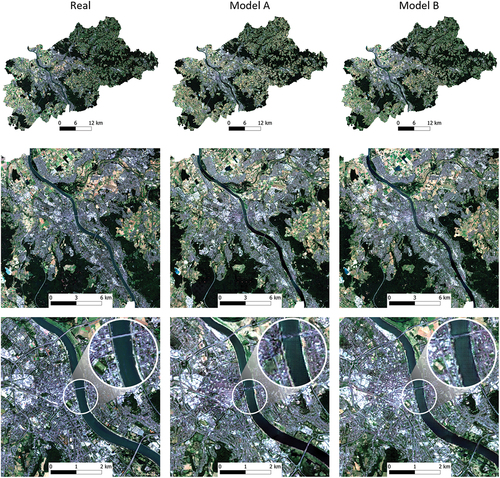
Figure 9. Difference and z-transformed difference between real and synthetic images.
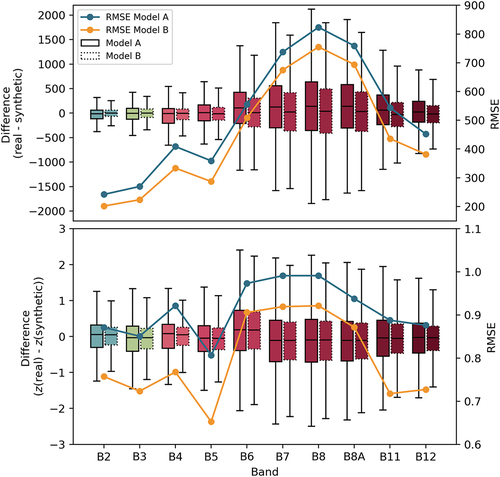
Figure 10. Spectral information divergence boxplots for each LULC class.
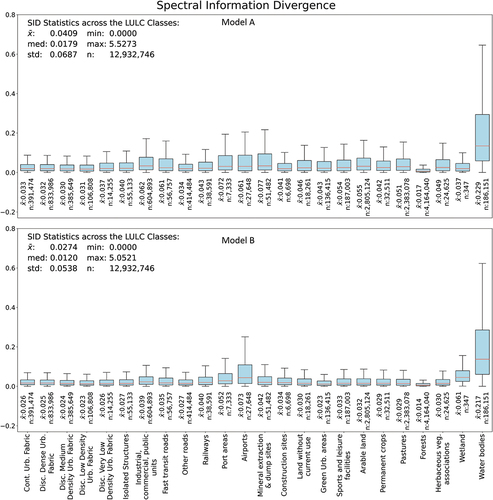
Figure 11. Spectral signatures of exemplary pixels.
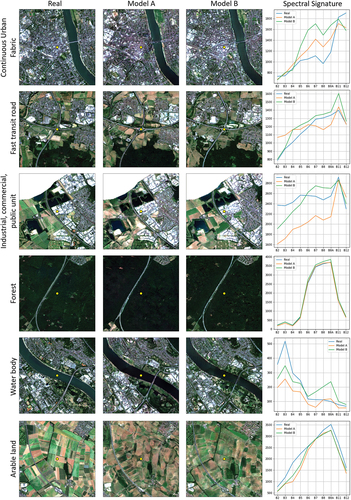
Table 3. FID for different channels and channel combinations. Better performance is highlighted in bold.
Table 4. Relevant Software and Python packages used in different stages of the research.
Data availability statement
Data available on request from the authors.