
Figures & data
Table 1. Environmental factors selected for modeling.
Figure 1. Global arid index and arid land distribution map; (a) global arid index (b) arid land categories.
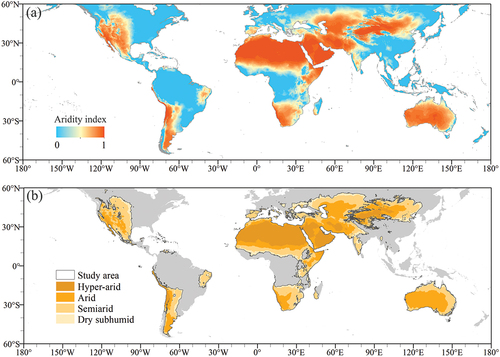
Figure 2. Number of high-quality observations and desertification indicators in arid areas globally; (a) minimum number of yearly cloud-free observations during 2000–2022; (b) average annual MSAVI; (c) average annual albedo; (d) average annual DDI; (e) correlation MSAVI and albedo time series coefficient; and (f) annual average scatter plot of MSAVI and albedo.
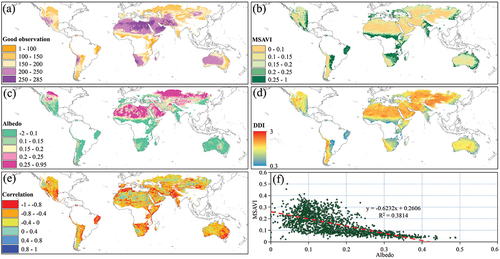
Figure 3. Technical flow chart of the study.
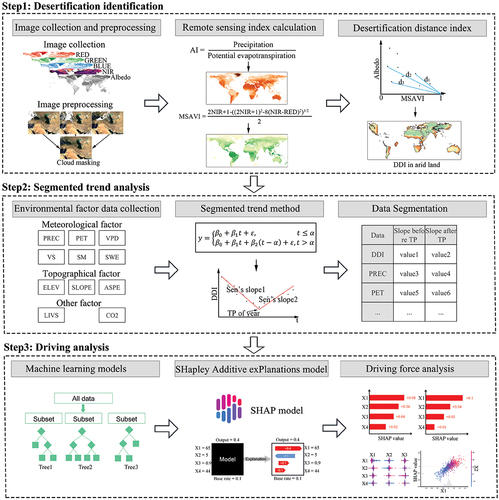
Figure 4. Comparison chart before and after DDI transition; (a) change trend of DDI before turning; (b) change trend of DDI after turning; (c) change type of DDI; and (d) time of DDI turning. Bar charts on the right show the proportion of each type on global arid land.
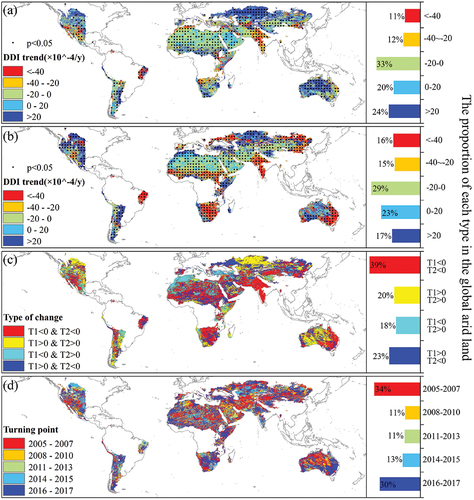
Figure 5. Violin plot of DDI trends in arid areas and continents; (a) T1 DDI variation in arid areas; (b) T2 DDI variation in arid areas; (c) T1 DDI variation in continents; and (d) T2 DDI variation in continents.
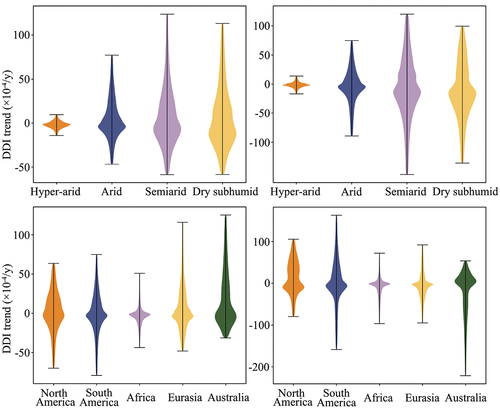
Figure 6. Segmental trends of main explanatory variables; (a) PREC change trend during T1; (b)PREC change trend during T2; (c) PET change trend during T1; (d) PET change trend during T2; (e) VPD change trend during T1; (f)VPD change trend during T2; (g) SM change trend during T1; and (h) SM change trend during T2.
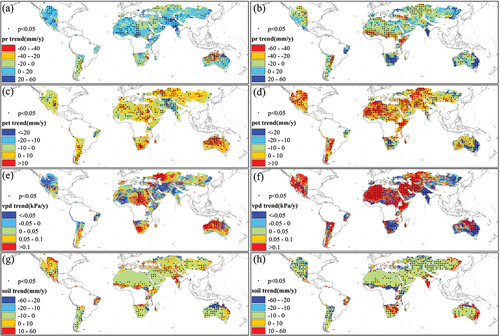
Figure 7. Driving force diagram of explanatory factors of desertification process; (a) global importance of factors during T1; (b) global importance of factors during T2; (c) local importance of factors during T1; and (d) local importance of factors during T2.
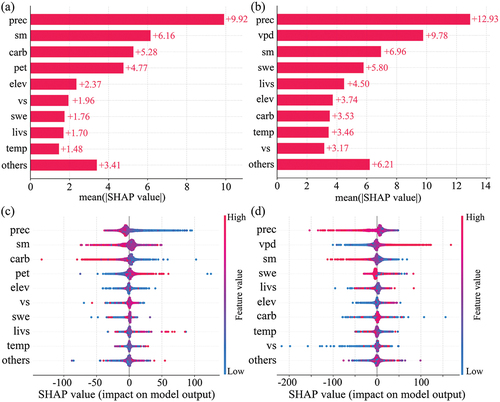
Figure 8. SHAP values of coupling effect between factors. (a) Coupling effect between factors during T1; (b) Coupling effect among factors during T2.
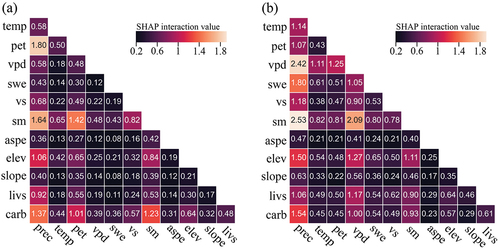
Figure 9. Coupling dependence scatter plots of main explanatory factors; (a) PREC ∩ PET, (b) PREC ∩ SM, (c) PET ∩ SM, (d) PREC ∩ SM, (e) VPD ∩ SM, and (f) PREC ∩ VPD.
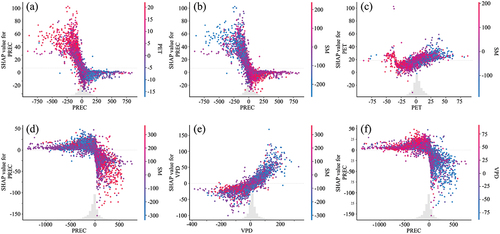
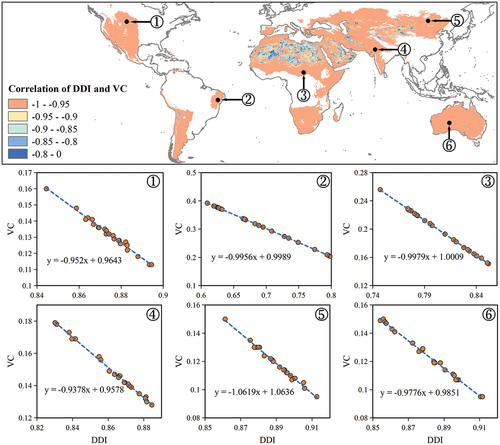
Figure 10. Correlation graph between Global Desertification Distance Index (DDI) and Vegetation Cover (VC).
Data availability statement
The raw data required to reproduce the above findings are available to download from https://modis.gsfc.nasa.gov/data/(MODIS. images) and https://www.climatologylab.org/terraclimate.html (Terraclimate data). The processed data required to reproduce the above findings are available to download from 10.6084/m9.figshare.25989064.v1 and 10.6084/m9.figshare.25990534.v1.