
Figures & data
Figure 1. The location of the study areas and sample collection points. (a) ~ (c) represent study site 3, study site 2 and study site 1, respectively. The points on the map represent the sample collection points. (d) ~ (f) Photos of crops taken during the field survey, including SR, DR, soybean and corn.
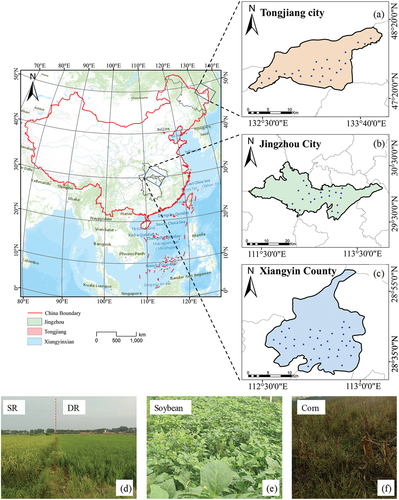
Figure 2. Rice phenology and the time of acquisition of the GF6 and Sentinel–2 images: (a) study site 1; (b) study site 2; (c) study site 3. The middle rice in the figure represents SR, and the DR contains both early rice and late rice.
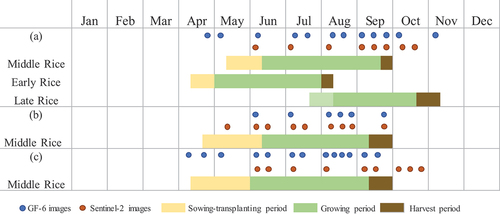
Table 1. The number of samples for the land cover types in the three study sites.
Figure 3. Comparison between the original data and interval feature data of the NDRE for DR and SR. The interval features include the mean f1(t1,t2), standard deviation f2(t1,t2) and slope f3(t1,t2). (a) is the original data and interval feature data of the NDRE for DR, while (b) is the original data and interval feature data of the NDRE for SR.
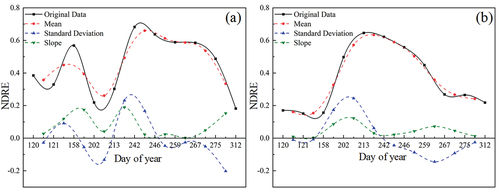
Figure 4. Schematic diagram of the GBT algorithm, where X represents the input features, and tree represents the decision tree. In this study, X refers to the interval features and Fourier coefficients of the time-series data.
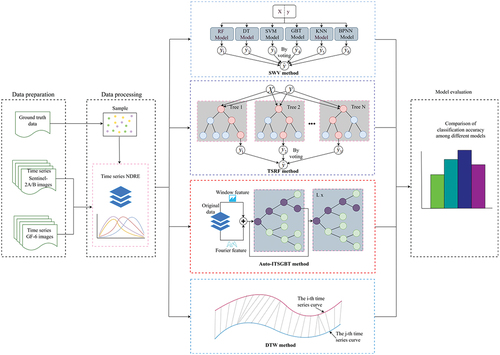
Figure 5. The flowchart compares the effectiveness of the Auto–ITSGBT method proposed in this paper with competing methods including the TSRF method, DTW method, and SWV method for rice mapping.
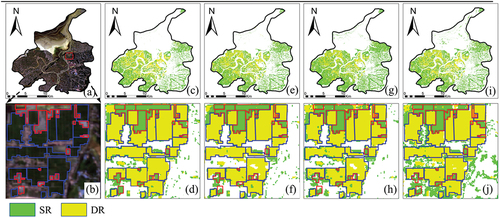
Figure 6. Results of rice mapping based on four methods at study site 1: (a–b) the original image and the local area (GF–6 on June 7, 2021); (c–d) Auto-ITSGBT-based rice mapping result; (e–f) TSRF-based rice mapping result; (g–h) DTW-based rice mapping result; (i–j) SWV-based rice mapping result.
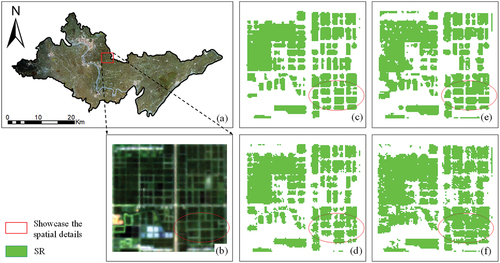
Table 2. Accuracy comparison of four rice mapping methods at study site 1.
Figure 7. Results of rice mapping based on four methods at study site 2: (a–b) the original image and the local area (GF–6 on August 17, 2021); (c) Auto–ITSGBT–based rice mapping result; (d) TSRF–based rice mapping result; (e) DTW–based rice mapping result; (f) SWV-based rice mapping result.
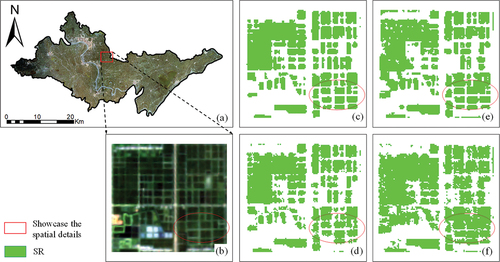
Figure 8. Results of rice mapping based on four methods at study site 3: (a–b) the original image and the local area (GF–6 on August 20, 2019); (c) Auto-ITSGBT-based rice mapping result; (d) TSRF-based rice mapping result; (e) DTW-based rice mapping result; (f) SWV-based rice mapping result.
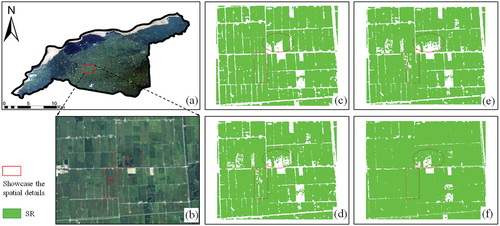
Table 3. Accuracy comparison of the four rice mapping methods at study sites 2 and 3.
Figure 9. Variation in OA with a gradual increase in the number of GF–6 and Sentinel-2 images based on the Auto-ITSGBT method.
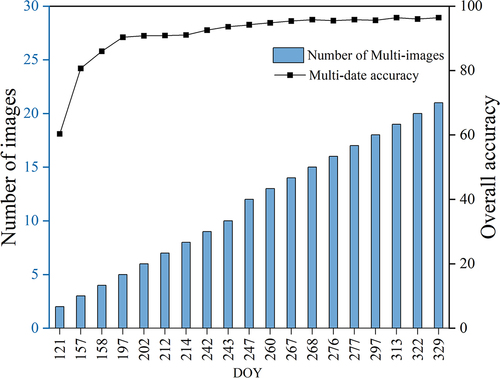
Figure 10. The harmonic curves at the frequency indices t = 0 to 4 obtained from GF–6–based NDRE curves of various crops by DFT.
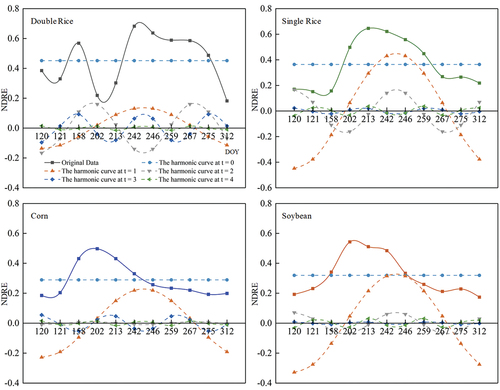
Table 4. Fourier coefficients of the GF-6-based NDRE curves for different crops at spectral coefficients t = 0 ~ 5.
Highlights.docx
Download MS Word (16.3 KB)Conflict of Interest.docx
Download MS Word (12.3 KB)Data availability statement
The data that support the findings of the study area are available from the first author [Xueqin Jiang, [email protected]] upon reasonable request.