Figures & data
Fig. 1. Schematic workflow of the study design including six procedural steps
Fig. 2. Means () and standard deviations (s) for GFR, GWR and GWINTR per development and room function. Abbreviations K, L, B stand for Kitchen, Living room and Bedroom respectively. Map data: Google
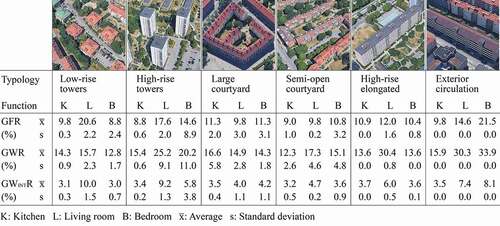
Fig. 3. Percentage of participants per age group and gender
Fig. 4. Questionnaire items: i) EL, the self-reported frequency of daytime electric lighting use throughout the year, ii) DA, the perceived area portion that is adequately daylit over the year and iii) PR, the preferred room function to be underlit, if there had to be one
Table 1. Combinations of EL and DA responses for each type of use (49 in total)
Table 2. Spearman rank correlation coefficient rS for overall sample SALL (n = 225), and for groups according to function, age, orientation and balcony obstruction
Table 3. Spearman rank correlation coefficient rS per room function, within different ranges of GFR, GWR, GWINTR, and different orientations
Table 4. Percentage of rooms per group with a given electric lighting use type. Markers (+) and (-) indicate that a percentage is significantly higher or lower (respectively) than what was expected (Binomial test)
Fig. 5. Proportion of each type of electric lighting use per orientation and room function. Cumulative percentages are shown for responsive OR responsive ± 1 rooms (green hues), and for irresponsive EL↑-DA↑ OR irresponsive EL↓-DA↓ rooms (red hues). The number of rooms per function and orientation is indicated by “n”. Markers “*” and “**” indicate significance at 0.05 and 0.01 respectively, for Binomial tests with an expected proportion of 50%
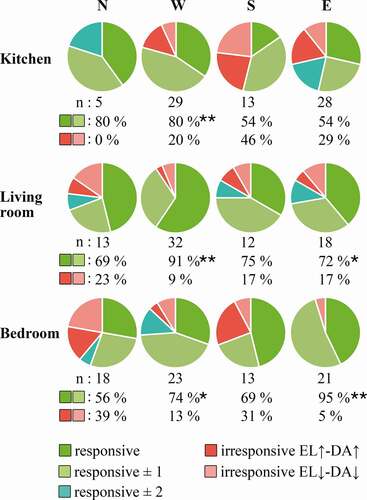
Fig. 6. Percentage of PR responses per category. The PR responses were given for the question: “If any of the rooms would be without daylight, which one would you choose” (). Indicated with “**” are percentages significantly higher or lower than 25%, as per the Binomial test results
Fig. 7. Percentage of PR responses per room function and age group. Significantly high or low percentages are marked with (+) or (-) respectively. The x-axis also shows the cumulative percentage of responses “Bedroom” or “I don’t know which one”. The percentages are marked with “*” and “**” when significantly higher than 50%, as per the Chi-square goodness-of-fit test (p < .05, p < .01 respectively)
Fig. 8. Percentage of high-frequency electric lighting use (EL ≥ 5) responses, per room function
Fig. 9. Percentage of low daylit area responses (DA ≤ 3) per room function