
Figures & data
Figure 1. Schematics of experimental steps.
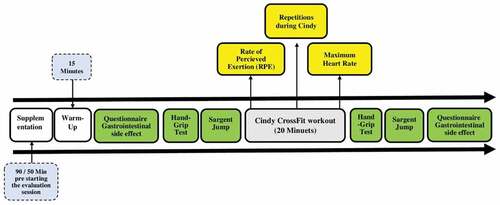
Figure 2. A comparison of variables between supplementations, PLA, and CON conditions before and after the Cindy protocol.
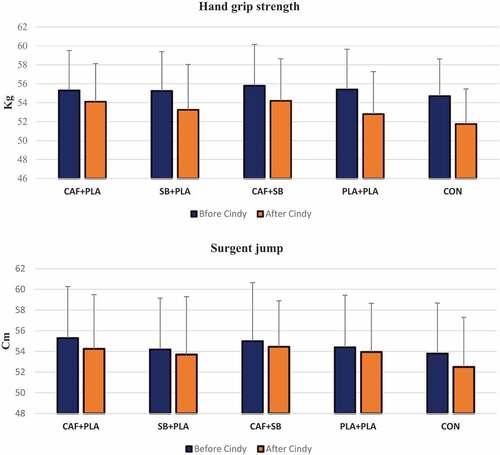
Figure 3. A comparison of variables between supplementations, PLA, and CON conditions during the Cindy protocol and the study.
Table 1. Descriptive statistics of handgrip strength, lower torso muscle power, performance, maximal heart rate, rate of perceived exertion, and gastrointestinal side effects variables in five supplementation conditions (mean ± SD).
Table 2. RPE in each level of the Cindy protocol (every 4 min).