Figures & data
Figure 1. Twitter activity of #Fridaysforfuture.
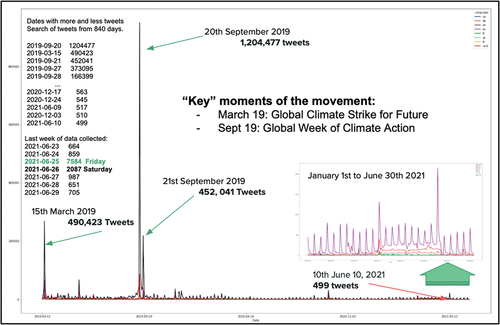
Figure 2. Chart of the methodological process.
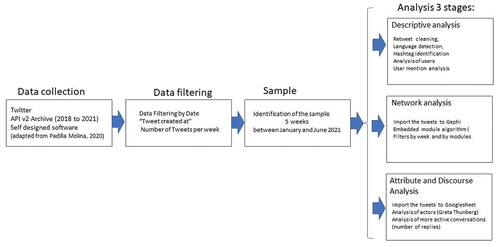
Table 1. Summary of the levels and procedures of analysis.
Figure 3. Networks per week-month (hashtags/users > 10 occurrences).
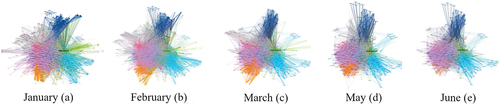
Figure 4. Module 3b (February) Network (hashtags/users > 10 occurrences with 8183 nodes distributed into 31 modules). Grey modules have fewer than 200 tweets.
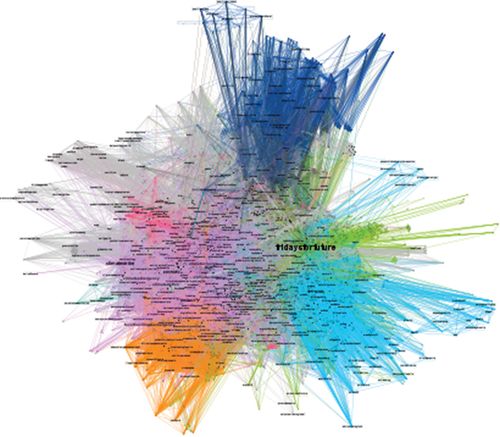
Figure 5. Network (hashtags/users > 10 occurrences). 5a. Module 4. 24% (2012 nodes). 5b. Module 14. 16.4% (1343 nodes). 5c. Module 8.14% (1151 nodes).5d. Module 31.8,32% (681 nodes). 5e. Module 11. 4,89% (400 nodes).Climate Strike. Climate Change politics.Fridays for future (only). German climate Twittersphere. Friday (Happy Friday, motivational, etc) Spanish politics and others.
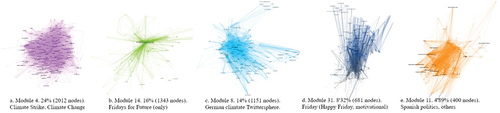
Figure 6. Hashtags about Greta Thunberg and Twitter. Module 5 Network (hashtags/users > 10 occurrences −3,29% 269 nodes).
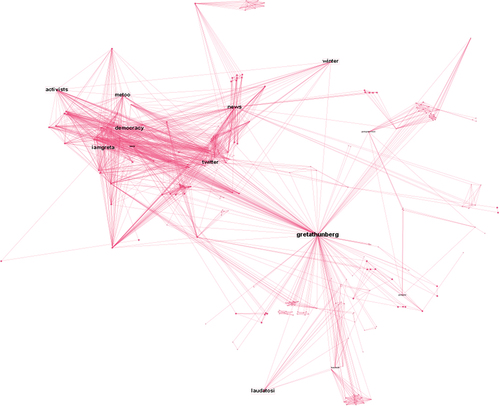
Figure 7. Main actors.
Figure 8. Greta Thunberg Tweet (included in the sample analysis): https://twitter.com/GretaThunberg/status/1398203250394996746.
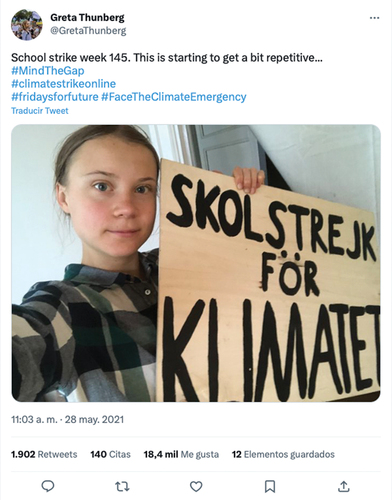
Table 1. Sample of 5 non-consecutive weeks with similar amounts of tweets.
Figure 1. Number of tweets per week-day. Friday peaks. Source: authors.
Figure 2. Number of tweets per week-day. Friday peaks. Source: authors.
Figure 3. Top hashtags used on the tweets. Number of occurrences per hashtag. Source: authors.
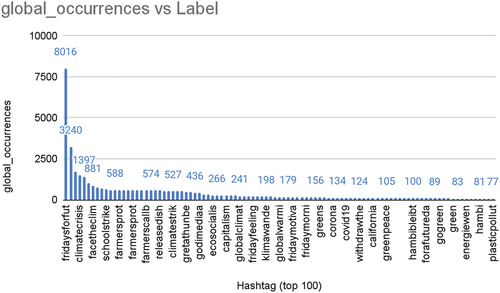
Figure 4. Top Hashtags per month. Source: authors.
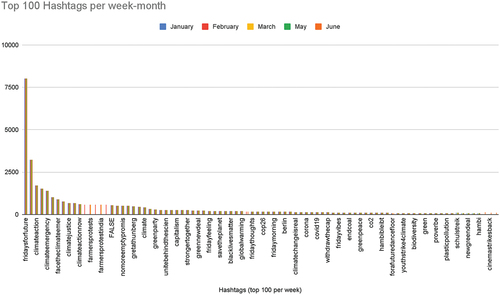
Figure 5. Who tweeted more? Source: authors.
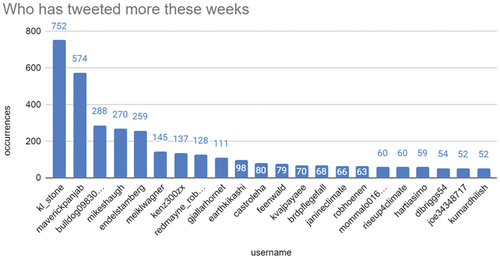
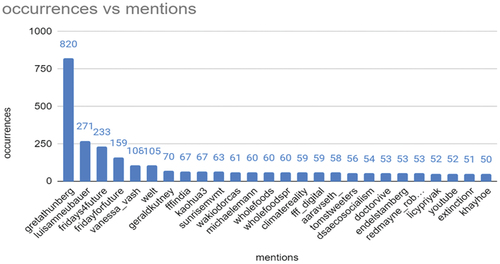
Figure 6. Who was more mentioned on tweets? Source: authors.