
Figures & data
Figure 1. PRISMA flow diagram of the systematic review (adapted from Page et al., Citation2021).
Figure 2. Publications by year and journal field.
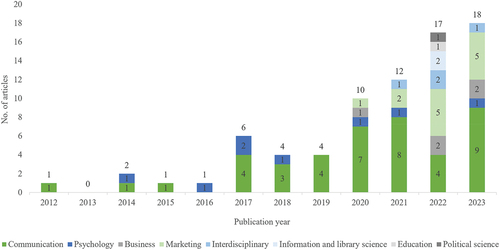
Table 1. Proposed typology of automated communication.
Table 2. Investigated automated communication phenomena according to context.
Table 3. Theories applied most often in automated communication research.