Figures & data
Figure 1. pH, TA, and TSS of the diet phalsa squash formulation during storage
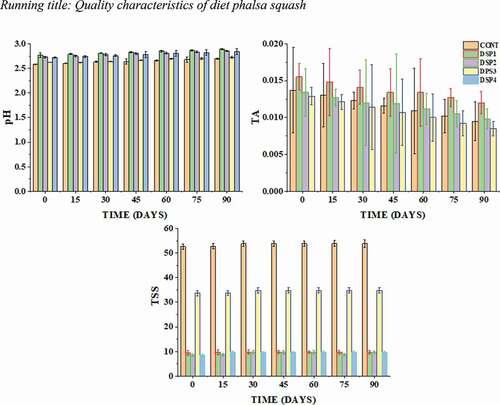
Figure 2. The phenolic and Vitamin C content of diet phalsa squash formulation during storage
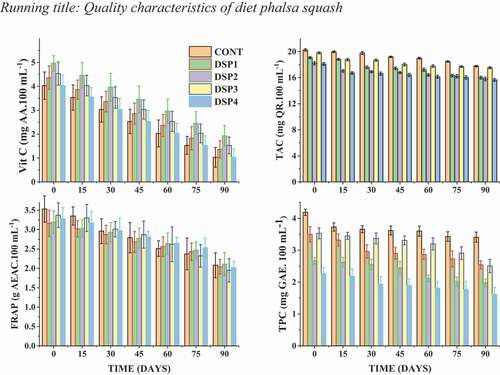
Figure 3. The phosphorus content of diet phalsa squash formulation during storage
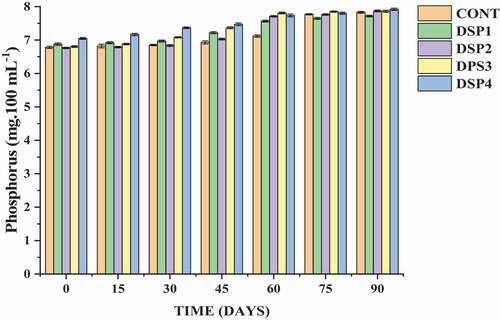
Table 1. Estimation of the model for phenolic compound and vitamin C degradation by examining the R2, χ2 and RMSE of zero-order, first-order, and second-order model
Table 2. The constants for zero-order and second-order model compound degradation
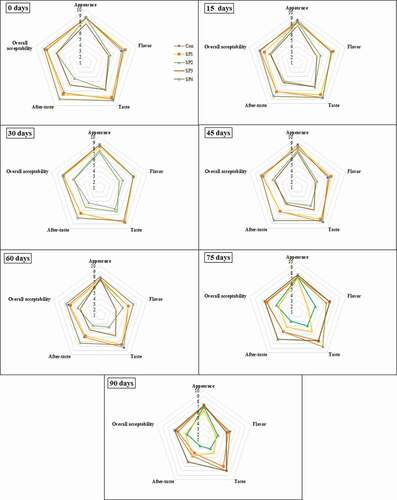
Figure 4. Sensory evaluations of diet phalsa squash