
Figures & data
Figure 1. Content of primary metabolites (PM) and sugar/acids ratio (S/A) in black currant fruit (A) and red currant fruit (F), heatmaps of individual primary metabolites in black currant fruit (B) and red currant fruit (G), heatmaps of main phenolic groups analyzed in black currant fruit (C) and red currant fruit (H) with exposing individual representatives of anthocyanins (ANT) for black currant fruit (D) and red currant fruit (I) and content of total analyzed phenolics (TAP) for black currant fruit (E) and red currant fruit (J). Different coloring in heatmaps indicates a different content of phenolic compounds – a lower color intensity determines a lower content of a certain primary metabolites (g kg−1 FW), phenolic compound (mg kg−1 FW) or the phenolic group (mg kg−1 FW). Abbreviations: FLA – flavanols, HCA – hydroxycinnamic acids, FLO – flavonols, FLN – flavanones, cy-3-glu: cyanidin-3-glucoside, cy-3-rut: cyanidin-3-rutinoside, peo-3-rut: peonidin-3-rutinoside, delph-3-(6ʺ-com)-glu: delphinidin-3-(6ʺ-coumaroyl)-glucoside, cy-3-(6ʺ-com)-glu: cyanidin-3-(6ʺ-comaroyl)-glucoside, delph-3-rut: delphinidin-3-rutinoside, delph-3-glu: delphinidin-3-glucoside, pel-3-rut: pelargonidin-3-rutinoside, delph-3-xyl: delphinidin-3-xyloside; cy-3-sambubioside: cyanidin-3-sambubioside, cy-3-sophoroside: cyanidin-3-sophoroside, cy-3-xylosyl rut: cyanidin-3-xylosyl rutinoside, cy-3-O-(2-glucosyl rut): cyanidin-3-O-(2-glycosyl rutinoside); T1 – T4 denote sampling dates during fruit ripening; letters a-d indicate a significant difference between sampling dates obtained by Duncan’s test at the .05 level of significance.
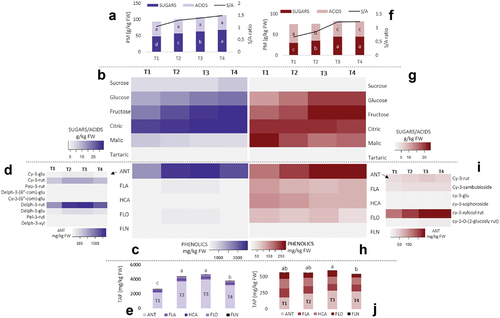
Figure 2. Correlation matrix of correlation tests between primary metabolites in red currant fruit (A) and black currant fruit (B). The values are R-values (Pearson’s correlation coefficient) for the correlation tests between the variables corresponding to x-axis and y-axis. The stars top-right to the R-values indicate the significance of the correlation: *** indicates p < .001, ** indicates p < .01, and * indicates p < .05. The midline histograms show the distribution of each set of data. The bottom-left scatterplots show correlation between the variables corresponding to the x-axis and y-axis.
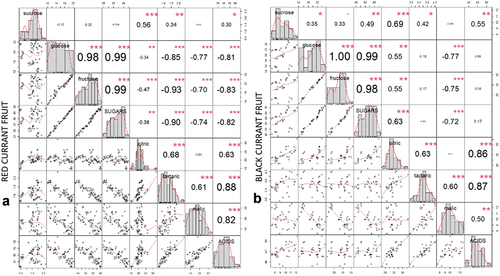
Figure 3. Correlation matrix of correlation tests between main analyzed metabolites (ANT – anthocyanins, FLA – flavanols, HCA – hydroxycinnamic acids, FLO – flavonols, FLN – flavanones, sugars and organic acids) in red currant fruit (A) and black currant fruit (B). The values are R-values (Pearson’s correlation coefficient) for the correlation tests between the variables corresponding to x-axis and y-axis. The stars top-right to the r-values indicate the significance of the correlation: *** indicates p < .001, ** indicates p < .01, and * indicates p < .05. The midline histograms show the distribution of each set of data. The bottom-left scatterplots show correlation between the variables corresponding to the x-axis and y-axis.
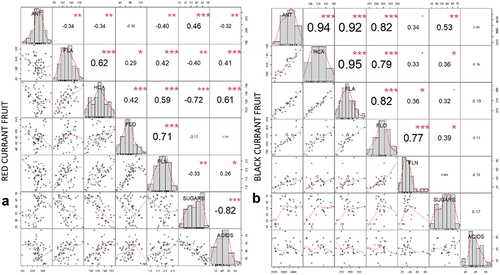
Figure 4. Dynamics of the phenolic profile of red currant leaves (A – based on phenolic groups; B – based on all identified individual phenolic compounds) and black currant leaves (C – based on phenolic groups; D – based on all identified individual phenolic compounds) during fruit ripening (T1-T4). Different coloring in heatmaps indicates a different content of phenolic compounds – a lower intensity determines a lower content of a certain phenolic compound or phenolic group (mg g−1 FW). Abbreviations: HCA: hydroxycinnamic acids, FLA: flavanols, FLO: flavonols, FLN: flavanones, p-CoA hexs: p-coumaric acid hexosides, 5-CQA1: 5-caffeoylquinic acid 1, 3-FQA: 3-feruloylquinic acid; 5-CQA2: 5-caffeoylquinic acid 2, caff acid der: caffeic acid derivative, 3-p-CQA: 3-p-caffeoylquinic acid, procy dims: procyanidin dimers, kaem hex rha hex: kaempferol hexosyl rhamnosyl hexoside, Q-pent rha hex: quercetin pentosyl rhamnosyl hexoside, myric-hex: myricetin hexosides, Q-pent-hex: quercetin pentosyl hexoside, kae-3-rut: kaempferol-3-rutinoside, Q-3-rha: quercetin-3-rhamnoside, Q-rha pent hex: quercetin rhamnosyl pentosyl hexoside, Q-rha hex: quercetin rhamnosyl hexoside, myric rha hex; myricetin rahmnosyl hexoside, Q-3-arapyr: quercetin-3-arabinopyranoside, kaem-3-gal: kaepferol-3-galactoside, Q-3-glucur: quercetin-3-glucuronide, Q-acetyl hex: quercetin acetyl hexoside, Q-dihex: quercetin-dihexoside, kaempf-gylcoside: kaempferol glycoside, Q-3-rut: quercetin-3-rutinoside, Q-3-glu: quercetin-3-glucoside, kaem-3-rut: kaempferol-3-rutinoside, iso-3-rut: isorhamnetin-3-rutinoside, Q-3-xyl: quercetin-3-xyloside, Nar hex: naringenin hexosides, 3-p-CoQA: 3-p-coumaroylquinic acid, 4-p-CoQA: 4-p-coumaroylquinic acid, kaem rham hex: kaempferol rhamnosyl hexoside.
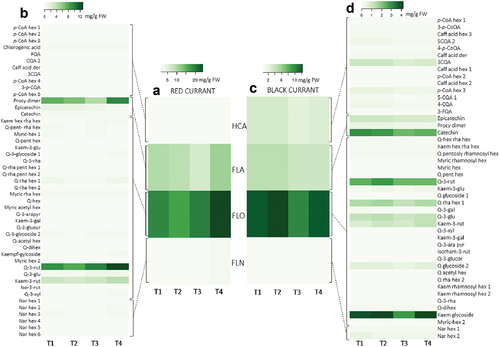
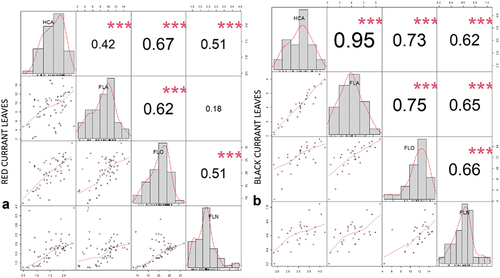
Figure 5. Correlation matrix of correlation tests between main analyzed phenolic groups (FLA – flavanols, HCA – hydroxycinnamic acids, FLO – flavonols, FLN – flavanones) in red currant leaves (A) and black currant leaves (B). The values are R-values (Pearson’s correlation coefficient) for the correlation tests between the variables corresponding to x-axis and y-axis. The stars top-right to the r-values indicate the significance of the correlation: *** indicates p < .001, ** indicates p < .01, and * indicates p < .05. The midline histograms show the distribution of each set of data. The bottom-left scatterplots show correlation between the variables corresponding to the x-axis and y-axis.
Supplemental Material
Download MS Word (61.9 KB)Data availability statement
The data that support the findings of this study are available from the corresponding author, [S.G.], upon reasonable request.