
Figures & data
Figure 1. Knockout of RB1CC1 results in loss of photoreceptor outer segment (POS)-induced autophagy in ARPE-19 cells. (A) Quantitative western blot analysis shows that siRNA against the RB1CC1 transcript (si-RB1 and si-RB2) significantly decreased the levels of LC3-II/LC3-I ratio, with or without the presence of bafilomycin A1 (BafA), after POS feeding. As a control, cells were also treated with a nonspecific siRNA sequence (Scramble). (B) Cells treated with RB1CC1-siRNA showed increased levels of SQSTM1, with or without the presence of BafA after POS feeding. SQSTM1 levels normalized to the ACTB/actin loading control. (C) Immunofluorescence analysis showed RB1CC1 siRNA-treated ARPE-19 cells have a significantly reduced punctate pattern of LC3 staining (green), consistent with the formation of fewer autophagosomes. Treatment of cells with si-RB1 or si-RB2 alone did not induce puncta formation. (D) Quantification of the number of autophagosomes per cell.
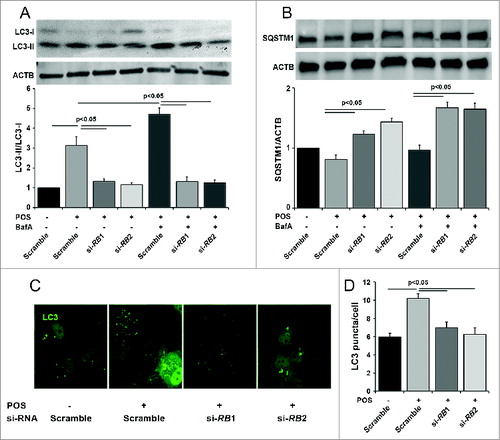
Figure 2. Conditional knockout of Rb1cc1 in the RPE results in the selective loss of autophagy activation in these cells. (A) Western blots, and (B) quantification of protein levels of RPE/choroid lysates from 2-mo-old Rb1cc1-CKO mice showed markedly reduced level of LC3-II and a significant accumulation of SQSTM1 as compared to littermate controls. Differences were significant at the P < 0.05 level. (C) Immunostaining confirmed the RPE-specific expression of Cre-recombinase (red). (D) Western blot of retina protein lysates showed normal levels of RB1CC1 and equal conversion of LC3-I to LC3-II. (E) Western blot, and (F) quantification of protein levels showed comparable amounts of phosphorylated-PTK2 (pPTK2), phosphorylated-MAPK8/JNK1-MAPK9/JNK2 (pMAPK8/9), and total PTK2 and MAPK, in the RPE from both Rb1cc1-CKO and control mice at the age of 2 mo. ONL, outer nuclear layer; RPE, retinal pigment epithelium.
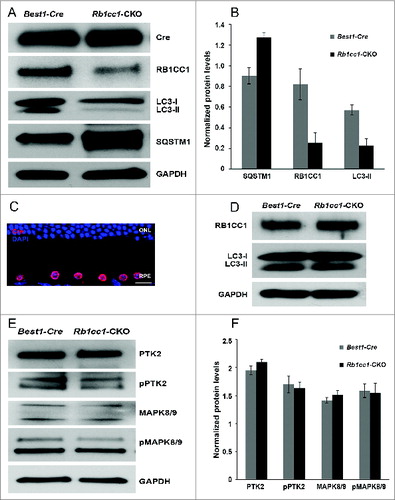
Figure 3. Retinal and RPE morphology are normal in Rb1cc1-CKO mice at 2 mo of age. (A–D) At the age of 2 mo, the outer retinas of the Rb1cc1-CKO and littermate controls were similar in appearance, as shown by OCT and DIC images of retina sections. (E, F) Immunostaining of RPE65 in Rb1cc1-CKO retina was identical to controls. (G) Quantification of outer nuclear layer thickness (yellow bar in [A]) of Rb1cc1-CKO and control mice measured with OCT. (H) Quantification of rod (scotopic) and cone (photopic) ERG showed no significant difference between Rb1cc1-CKO and control mice. GCL, ganglion cell layer; INL, inner nuclear layer; IS, inner segment; ONL, outer nuclear layer; OS, outer segment; RPE, retinal pigment epithelium.
![Figure 3. Retinal and RPE morphology are normal in Rb1cc1-CKO mice at 2 mo of age. (A–D) At the age of 2 mo, the outer retinas of the Rb1cc1-CKO and littermate controls were similar in appearance, as shown by OCT and DIC images of retina sections. (E, F) Immunostaining of RPE65 in Rb1cc1-CKO retina was identical to controls. (G) Quantification of outer nuclear layer thickness (yellow bar in [A]) of Rb1cc1-CKO and control mice measured with OCT. (H) Quantification of rod (scotopic) and cone (photopic) ERG showed no significant difference between Rb1cc1-CKO and control mice. GCL, ganglion cell layer; INL, inner nuclear layer; IS, inner segment; ONL, outer nuclear layer; OS, outer segment; RPE, retinal pigment epithelium.](/cms/asset/e305b4b5-953b-4b5e-8670-3a13d2bfb03a/kaup_a_1041699_f0003_c.jpg)
Figure 4. RPE degeneration present by 4 mo of age. (A, B) Fundus photograph shows the significant RPE atrophy present in the Rb1cc1-CKO mice, as compared to littermate controls. ON signifies the optic nerve. Yellow and red arrows point to representative foci of RPE atrophy and clumping, respectively. (C, D) OCT imaging shows the increased granularity of the RPE reflectance and the presence of hyperreflective foci located above the RPE (yellow arrows). (E, F) Fluorescein angiography showed a normal retinal vasculature in both groups of mice. (G, H) Immunostaining for the Cre-recombinase (red) showed that there was no RPE degeneration in the Best1-Cre control retinas, but only in the Rb1cc1-CKO retinas where there was Cre expression. Staining for CD68 showed infiltration of macrophages into the areas of degenerating RPE. (I–K) Transmission electron microscopy showed that there were significantly more unprocessed phagosomes (yellow arrows) present in the RPE of the Rb1cc1-CKO mouse, as compared to littermate controls. IS, inner segment; OCT, optical coherence tomography; ONL, outer nuclear layer; OS, outer segment; RPE, retinal pigment epithelium.
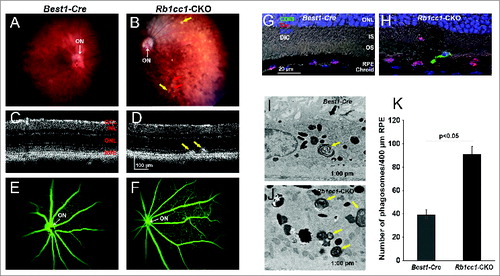
Figure 5. Inability to activate autophagy results in continued age-dependent degeneration of the RPE. (A, B) Fundus photograph of retina from 8-mo-old Rb1cc1-CKO mouse shows significant RPE degeneration. (C–E) Photomicrographs show the vacuolization of the RPE (yellow arrows), and areas of atrophy. Note the disruption of the outer nuclear layer of the retina (red arrow) where the RPE is absent (rectangle). (F, G) Flat mounts stained for the tight junction protein TJP1/ZO-1 show marked disruption of the normal hexagonal pattern of the RPE, and increased staining of IBA1-positive cells, consistent with increased infiltration of activated microglia. GCL, ganglion cell layer; INL, inner nuclear layer; IS, inner segment; ONL, outer nuclear layer; OS, outer segment; RPE, retinal pigment epithelium.
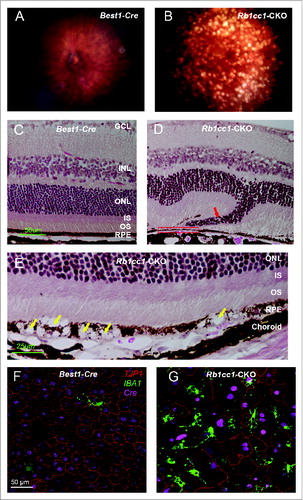
Figure 6. Loss of autophagy in the RPE results in disruption of the normal interface with Bruch's membrane. (A, B) Staining of retinal sections with an antibody against CD29, a component of the ITGB1/integrin β-1 complex and a marker of the basal surface of the RPE, shows disruption of the normally continuous linear structure. (C) Histological section of a retina from an 8-mo-old Rb1cc1-CKO mouse shows a focus of vascular ingrowth from the choroid through the RPE and into the retina (red arrow), consistent with a focus of choroidal neovascularization. (F) This finding was also seen on OCT imaging of the retina (red arrow). (E, F) Staining with the vascular marker, IB4, confirms that the ingrowth contained blood vessels. GCL, ganglion cell layer; INL, inner nuclear layer; IS, inner segment; ONL, outer nuclear layer; OS, outer segment; RPE, retinal pigment epithelium.
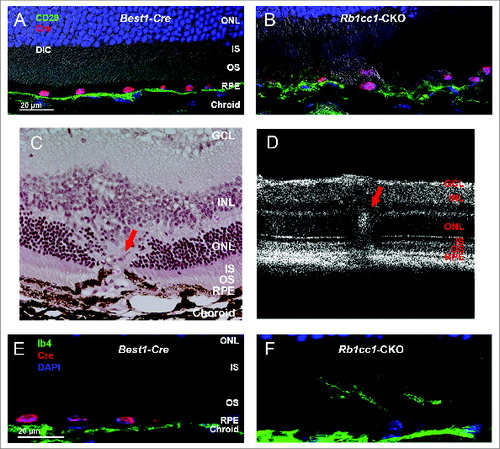
Figure 7. Subretinal inflammation and increased autofluorescence was detected in Rb1cc1-CKO mice. (A, B) Loss of autophagy activation resulted in increased deposition of C3 (complement component 3) and (C, D) oxidatively-damaged proteins on the basal surface of the RPE. There was also increased accumulation of autofluorescent puncta within the RPE (E, F). Photomicrographs are of sections taken from 8-mo-old mice. In all cases, abnormalities were only seen in the Rb1cc1-CKO mouse, and not in the Best1-Cre mouse, even in areas of Cre expression. IS, inner segment; ONL, outer nuclear layer; OS, outer segment; RPE, retinal pigment epithelium.
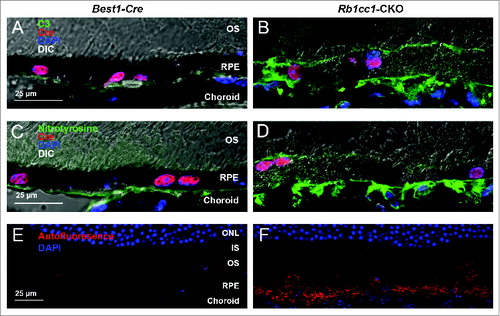
Figure 8. There was increased accumulation of lipid-filled vacuoles within the RPE of the Rb1cc1-CKO mice as compared to littermate controls. (A–C) Sections from eyes of 8-mo-old mice stained with Oil Red O show the disruption of the normal RPE architecture the presence of large, lipid-filled structures (yellow arrows). (D–F) Electron microscopy shows that the lipid is contained within variably sized vacuoles, some of which are large enough to displace the normal RPE melanin content. BRU, Bruch's membrane; IS, inner segment; ONL, outer nuclear layer; OS, outer segment; RPE, retinal pigment epithelium.
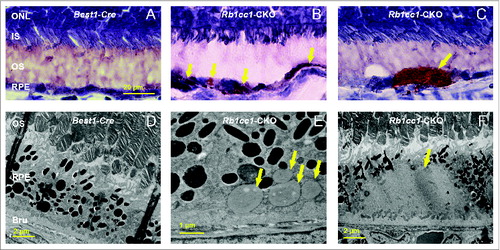
Figure 9. There were decreased levels of lysosome markers consistent with defective processing of intracellular debris. Western blots (A), and quantification (B) showing decreased levels of the lysosome proteins LAMP1 and mature CTSD/cathepsin D (M-CTSD) in the RPE of the Rb1cc1-CKO mice as compared to littermate controls.
Figure 10. Loss of autophagy in the RPE results in accumulation of intracellular debris. The Rb1cc1-CKO mice had a significant accumulation of SQSTM1 (A, B) and ubiquitin-tagged debris (C, D) within the RPE, as well as increased accumulation of mitochondria (E, F), as compared to littermate controls. These findings are consistent with decreased autophagy flux in these cells. OS, outer segment; RPE, retinal pigment epithelium.
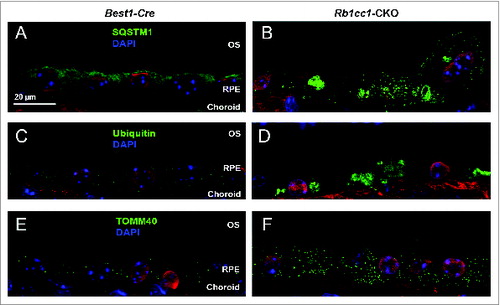
Figure 11. RPE degeneration leads to retinal degeneration. Loss of autophagy function in the RPE resulted in a secondary loss of photoreceptors. (A) The retinal thinning was due to reduction in the ONL as seen on cross section OCT imaging of 8-moold mice, and (B) the automated ONL thickness measurement shown as a heat map. (C) Manual measurement of the ONL thickness vs. total retinal thickness confirmed the automated measurements. (C, D) There was decreased scotopic and photopic electroretinography responses, consistent with the loss of photoreceptors.
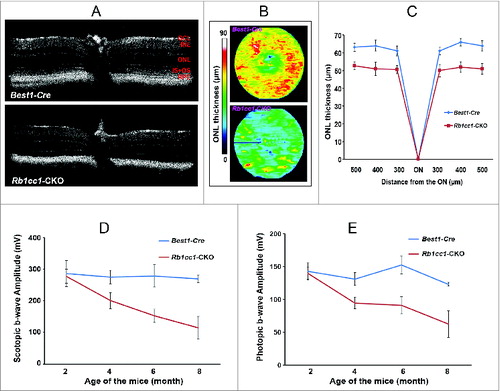
Table 1. List of antibodies used in this study