Figures & data
Figure 1. Detachment from the ECM triggers autophagosome formation in intestinal epithelial cells. (A, B) Nonmalignant intestinal epithelial cells IEC-18 cells were transfected with the GFP-LC3B expression vector, cultured attached to or detached from the ECM for 24 h in the absence (−) or in the presence (+) of 50 nM bafilomycin A1 (BafA1) and green puncta per cell were counted. (A) Representative fluorescence microscopy images of the attached and detached cells. (B) Quantification of the number of green puncta per cell. The numbers represent the average of the number of puncta per cell observed for 30–40 cells plus the SE. This experiment was repeated 3 times with similar results. (C–E) IEC-18 cells were transduced with the mCherry-GFP-LC3-encoding virus, cultured attached to (att) or detached from (det) the ECM for the indicated times and green, red, or yellow puncta were counted. (C) Representative fluorescence microscopy images of the attached and detached cells. (D, E) Quantification of the number of yellow (D) and red (E) puncta per cell performed within the same experiment. The numbers represent the average of the number of puncta per cell observed for 30–40 cells plus the SE. This experiment was repeated twice with similar results. (F) IEC-18 cells were cultured attached (att) to or detached from (det) the ECM for 20 h and assayed for MAP1LC3B expression by western blot. Positions of MAP1LC3B-I and MAP1LC3B-II on the gel are indicated. (G, H) IEC-18 cells were cultured attached (att) to or detached from the ECM (det) for the indicated times and in the presence of 50 nM bafilomycin A1 (BafA1) and assayed for MAP1LC3B expression by western blot. (I) IEC-18 cells were transfected with the GFP-LC3 expression vector, cultured attached to or detached from the ECM for 24 h and assayed by western blot by using an anti-GFP antibody. Positions of GFP-LC3B and free GFP on the gel are indicated. CDK4 was used as a loading control in (F) and ACTB in (G–I). *, p < 0.05.
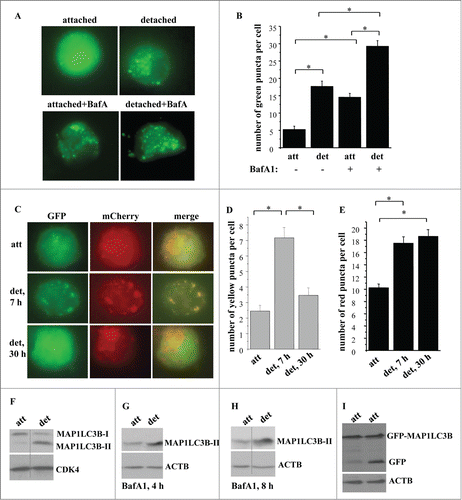
Figure 2. Detachment from the ECM triggers growth arrest and apoptosis of intestinal epithelial cells. (A) IEC-18 cells were cultured attached to or detached form the ECM for 15 h and assayed for the distribution of the cells in phases of the cell cycle by flow cytometry. Percentage of the cells in the S phase of the cell cycle is shown. The numbers represent the average of 2 independent experiments plus the SD. (B) The cells were cultured as in (A), stained with propidium iodide (PI) and ANXA5 and assayed for ANXA5 and PtdIns binding by flow cytometry. Percent apoptosis was calculated as the sum of the percentages of ANXA5-positive-PI-negative cells (undergoing early stages of apoptosis) and ANXA5-positive-PtdIns-positive cells (undergoing late stages of apoptosis). The numbers represent the average of 2 independent experiments plus the SD. * Indicates that the p-value was less than 0.05.
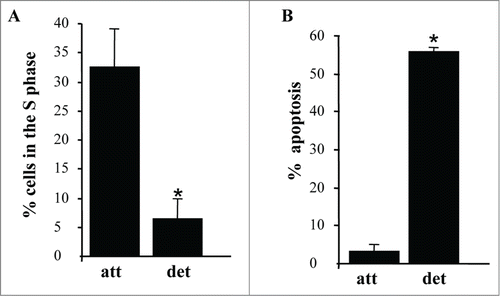
Figure 3. Detachment from the ECM does not alter the levels of UVRAG, SH3GLB1, ATG16L1, ATG10, and ATG12-ATG5 conjugate in intestinal epithelial cells. (A–D) IEC-18 cells were cultured attached to (att) or detached (det) from the ECM for 20 h and assayed for the expression of the indicated proteins by western blot. CDK4 was used as a loading control in (A, B, D), ACTB in (C) and GAPDH (glyceraldehyde 3-phosphate dehydrogenase) in (E).
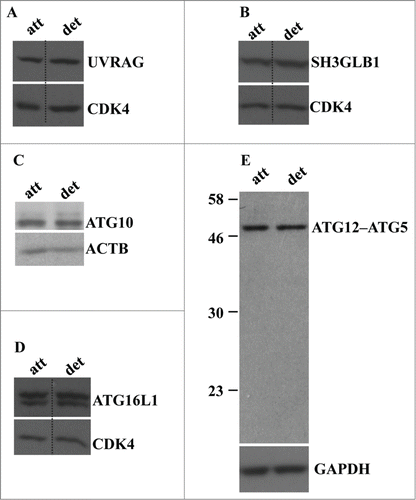
Figure 4. Detachment from the ECM triggers ATG3 and ATG7 upregulation in intestinal epithelial cells. (A, B) IEC-18 cells were cultured attached (att) to or detached from (det) the ECM for the indicated times and assayed for ATG3 (A) or ATG7 (B) protein expression by western blot. (D, E) Human nonmalignant intestinal epithelial Hkh-2 cells were cultured attached (att) to or detached (det) from the ECM for the indicated times and assayed for ATG3 (C) or ATG7 (D) protein expression by western blot. (E, F) IEC-18 cells were cultured attached to or detached from the ECM for 24 h and assayed for ATG3 (E) or ATG7 (F) mRNA levels by qPCR. The observed ATG3 and ATG7 mRNA levels were normalized by the levels of RNA18S/18S rRNA, which were also determined by qPCR. The resulting levels of ATG3 (E) or ATG7 (F) mRNA in the detached cells were arbitrarily designated as 1.0. The data represent the average of 4 independent experiments plus the SD in (E) and 2 independent experiments in (F). * indicates that the p-value was less than 0.05. (G–I) IEC-18 cells were cultured attached to or detached from the ECM for the indicated times and assayed for ATG3 (G), ATG7 (H) or MAP1LC3B (I) protein expression by western blot. Positions of MAP1LC3B-I and MAP1LC3B-II on the gel are indicated. ACTB was used as a loading control in (A, B, G–I) and MAPK/p38 in (C, D).
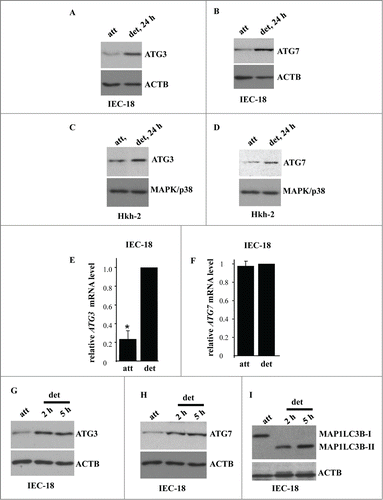
Figure 5. For figure legend,see page 1238.
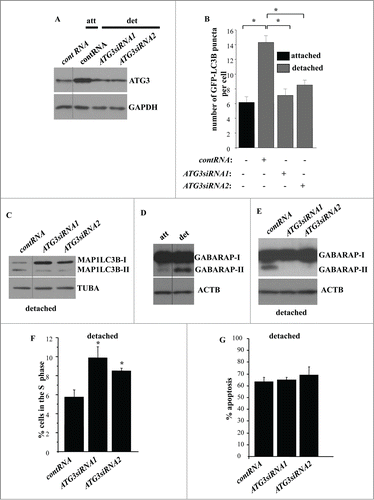
Figure 6. GABARAP ablation increases the fraction of detached intestinal epithelial cells in the S-phase of the cell cycle. (A) IEC-18 cells were transfected with 100 nM control RNA (contRNA) or GABARAP-specific small interfering RNA (GABARAPsiRNA)2 or 3 and assayed for GABARAP expression by western blot. ACTB was used as a loading control. (B) IEC-18 cells were treated as in (A), detached from the ECM for 14h and assayed for the distribution of the cells in phases of the cell cycle by flow cytometry. Percentage of the cells in the S phase of the cell cycle is shown. The numbers represent the average of 3 independent experiments plus the SD. * indicates that the p-value was less than 0.05.
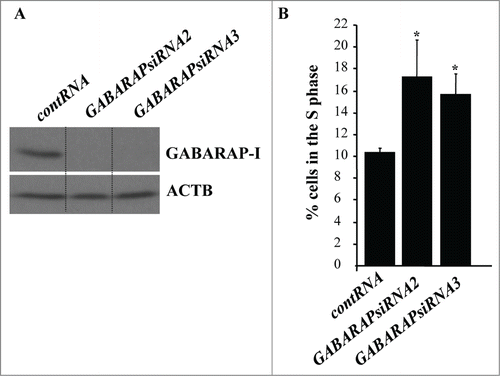
Figure 7. ATG3 upregulation in attached intestinal epithelial cells does not trigger their autophagy or cell cycle arrest but promotes apoptosis. (A) IEC-18 cells were infected with 4 × 10⁴ viral particles per cell of the control retrovirus (cont virus) or ATG3-encoding retrovirus (ATG3 virus), treated with 2 μg/ml puromycin for 24 h and assayed for ATG3 expression by western blot along with IEC-18 cells that were detached for 20 h. The positions of endogenous ATG3 (endog. ATG3) and exogenous His-tagged ATG3 (exog. ATG3) on the gel are indicated. CDK4 was used as a loading control. (B, left) IEC-18 cells were cultured attached (att) to or detached (det) from the ECM for 20 h and assayed for MAP1LC3B expression by western blot. Positions of MAP1LC3B-I and MAP1LC3B-II on the gel are indicated. (B, right) IEC-18 cells infected with the indicated viruses as in (A) were cultured attached to the ECM for an additional 20 h and analyzed as in (B, left). (C) IEC-18 cells infected with the indicated viruses as in (A) were transiently transfected with a GFP-LC3B expression vector and plated attached to or detached from the ECM for 20 h and analyzed for the presence of GFP-LC3B puncta as in . The results represent the average of the number of GFP-LC3B puncta per cell observed for 30–45 cells plus the SE. (D) IEC-18 cells infected with the indicated viruses as in (A) were cultured attached to the ECM for an additional 24 h and assayed for the distribution of the cells in phases of the cell cycle by flow cytometry. Percentage of the cells in the S phase of the cell cycle is shown. The numbers represent the average of 3 independent experiments plus the SD. (E) IEC-18 cells infected with the indicated viruses as in (A) were cultured attached to the ECM for an additional 24 h and assayed for ANXA5 binding. The numbers represent the average of 2 independent experiments plus the SD. (F) IEC-18 cells infected with the indicated viruses as in (A) were cultured attached to the ECM for 7–10d. Cell colonies were then stained and counted. The numbers represent the average of the triplicates plus the SD. This experiment was repeated twice with similar results. Relative cell survival was calculated as the number of colonies formed by the ATG3-expressing cells relative to that formed by the control cells which was arbitrarily designated as 1.0. * indicates that the p-value was less than 0.05.
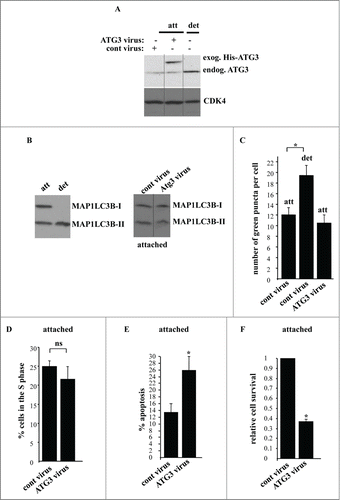
Figure 8. Lysine 243 of ATG3 is not required for the ability of ATG3 to kill attached intestinal epithelial cells. (A) IEC-18 cells were infected (+) or not infected (−) with 4 × 10⁴ viral particles per cell of the control retrovirus (cont virus) or ATG3-encoding retrovirus (ATG3 virus), or the virus encoding ATG3 in which K243 was mutated to arginine (ATG3KR virus), treated with 2 μg/ml puromycin for 24 h and assayed for ATG3 expression by western blot. CDK4 was used as a loading control. (B) IEC-18 cells treated as in (A) were assayed for survival as in . The numbers represent the average of triplicates plus the SD. This experiment was repeated twice with similar results. * indicates that the p-value was less than 0.05.
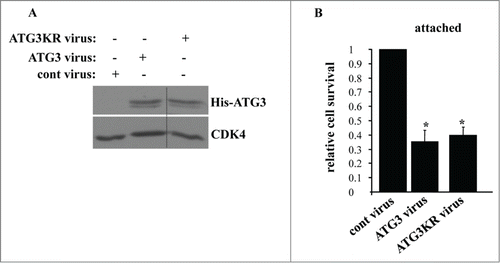
Figure 9. Detachment-induced upregulation of ATG7 contributes to autophagosome formation in detached intestinal epithelial cells. (A) IEC-18 cells IEC-18 cells were transfected with 100 nM control RNA (cont RNA) or ATG7-specific small interfering RNA (ATG7siRNA)4 (left) or 19 (center) and cultured detached from the ECM for 20 h (left, center). IEC-18 cells transfected as above were cultured attached to the ECM for 20 h in case of the control RNA or detached from the ECM for 20 h in case of ATG7siRNAs 4 and 19 and assayed for ATG7 expression by western blot. (B) IEC-18 cells were transfected (+) or not transfected (−) as in (A), then transiently transfected with a GFP-LC3B expression vector, detached from the ECM for 12 h and assayed for the presence of GFP-LC3B puncta as in . The results represent the average of the number of GFP-LC3B puncta per cell observed for 60–120 cells plus the SE. This experiment was repeated twice with similar results. * indicates that the p-value was less than 0.05. (C) IEC-18 cells were transfected as in (A), cultured for 16 h detached from the ECM and assayed for GABARAP expression by western blot. Positions of GABARAP-I and GABARAP-II on the gel are indicated. ACTB was used as a loading control in (A and C).
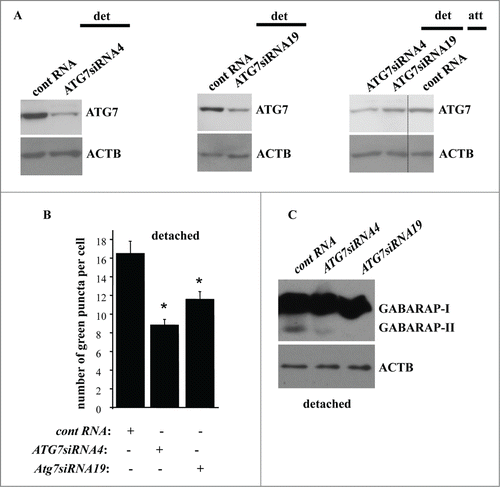
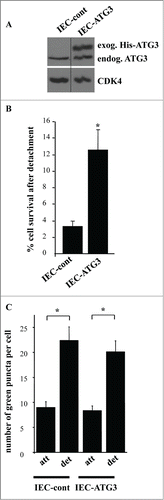
Figure 10. Intestinal epithelial cells that are resistant to apoptosis induced by ATG3 are also resistant to apoptosis triggered by their detachment from the ECM. (A) IEC-18 cells were infected with 4 × 10⁴ viral particles per cell of the control retrovirus or ATG3-encoding retrovirus and cultured in the presence of 2 μg/ml puromycin until the respective control cell line (IEC-cont) and ATG3-overexpressing cell line (IEC-ATG3) were established. Cells were then assayed for ATG3 expression by western blot as in . (B) The indicated cell lines were plated in monolayer culture either immediately or after being cultured without adhesion to the ECM for 16 h. Cell colonies were allowed to form for 7–10 d. The colonies were then stained and counted. “% cell survival after detachment” was calculated as the percentage of the colonies formed by the cells re-plated after detachment relative to that formed by the attached cells. The results represent the average of triplicates plus the SD. This experiment was repeated twice with similar results. * indicates that the p-value was less than 0.05. (C) The indicated cell lines were transiently transfected with a GFP-LC3B expression vector, cultured attached to (att) or detached from (det) the ECM for 12 h and assayed for the presence of GFP-LC3B puncta as in . The results represent the average of the number of GFP-LC3B puncta per cell observed for 24–40 cells plus the SE.