7,637
Views
167
CrossRef citations to date
0
Altmetric
Basic Research Paper

A novel autophagy/mitophagy inhibitor liensinine sensitizes breast cancer cells to chemotherapy through DNM1L-mediated mitochondrial fission

, , , , , , , & show all
Pages 1259-1279 | Received 09 Dec 2014, Accepted 26 May 2015, Published online: 14 Aug 2015

Figures & data

Figure 1 (See previous page). Liensinine induces autophagic/mitophagic alterations in MDA-MB-231 and MCF-7 cells. (A) The chemical structure of liensinine. (B) EGFP-LC3 expressing MDA-MB-231 and MCF-7 cells were treated without or with liensinine (Lien, 20 μM) for 24 h, the EGFP-LC3 puncta were observed under confocal microscopy; scale bars: 10 μm. (C) Quantification of average EGFP puncta per cell in (B) from 3 independent experiments. Data was presented as mean ± SD (**P < 0.01); 50 cells were analyzed per treatment condition. (D and E) Cells were exposed to various concentrations of Lien for 24 h, or treated with 20 μM Lien for different time intervals as indicated. The expression of autophagy-related proteins (LC3B-I/LC3B-II, SQSTM1, BECN1 and LAMP1) was detected by western blot analysis. GAPDH was used as a loading control. (F) Representative TEM images depicting ultrastructure of MDA-MB-231 and MCF-7 cells treated without or with Lien (20 μM) for 24 h. N, nucleus; M, mitochondria; red arrows indicates autophagic vacuoles. Scale bars: 2 μm. (G) Confocal microscopy images of MDA-MB-231 and MCF-7 cells treated without or with Lien (20 μM) for 24 h after co-expressing RFP-mito and EGFP-LC3; scale bars: 10 μm. Quantitation of EGFP puncta with RFP-mito per cell. Data was presented as mean ± SD (**P < 0.01); 50 cells were analyzed per treatment condition.
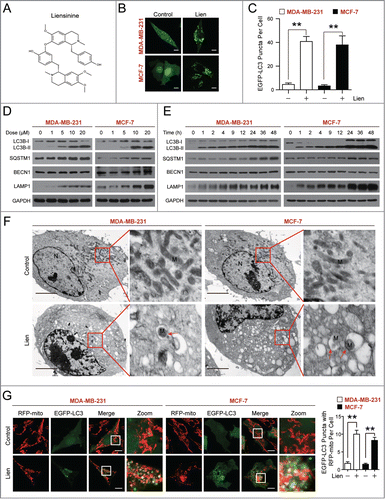
Figure 1 (See previous page). Liensinine induces autophagic/mitophagic alterations in MDA-MB-231 and MCF-7 cells. (A) The chemical structure of liensinine. (B) EGFP-LC3 expressing MDA-MB-231 and MCF-7 cells were treated without or with liensinine (Lien, 20 μM) for 24 h, the EGFP-LC3 puncta were observed under confocal microscopy; scale bars: 10 μm. (C) Quantification of average EGFP puncta per cell in (B) from 3 independent experiments. Data was presented as mean ± SD (**P < 0.01); 50 cells were analyzed per treatment condition. (D and E) Cells were exposed to various concentrations of Lien for 24 h, or treated with 20 μM Lien for different time intervals as indicated. The expression of autophagy-related proteins (LC3B-I/LC3B-II, SQSTM1, BECN1 and LAMP1) was detected by western blot analysis. GAPDH was used as a loading control. (F) Representative TEM images depicting ultrastructure of MDA-MB-231 and MCF-7 cells treated without or with Lien (20 μM) for 24 h. N, nucleus; M, mitochondria; red arrows indicates autophagic vacuoles. Scale bars: 2 μm. (G) Confocal microscopy images of MDA-MB-231 and MCF-7 cells treated without or with Lien (20 μM) for 24 h after co-expressing RFP-mito and EGFP-LC3; scale bars: 10 μm. Quantitation of EGFP puncta with RFP-mito per cell. Data was presented as mean ± SD (**P < 0.01); 50 cells were analyzed per treatment condition.

Figure 2. Liensinine inhibits autophagic degradation in MDA-MB-231 cells. (A) MDA-MB-231 cells stably expressing EGFP-LC3 were treated without or with Lien (20 μM) in the presence or absence of 25 nM Baf for 24 h, and total EGFP intensity was measured by flow cytometry. Data are presented as mean ± SD from 3 independent experiments (n.s, not significant, **P < 0.01). (B) Cells were treated without or with Lien (20 μM), or Rapa (0.25 μM) in the presence or absence of 25 nM Baf for 4 h or 24 h; the expression of SQSTM1 and LC3B-II was analyzed by western blot. (C) Cells were transfected with a tandem reporter construct (tfLC3), and were exposed to Lien (20 µM), Baf (20 nM) and Rapa (0.25 μM) as indicated. The colocalization of EGFP and mRFP-LC3 puncta was examined by confocal microscopy. Scale bars: 10 μm. (D) Cells were treated without or with Rapa (0.25 μM) in the presence or absence of 20 μM Lien for 24 h, the expression of SQSTM1 and LC3B-II was analyzed by western blot. Comparisons of the intensities were statistically estimated and represented as mean ± SD for 3 independent experiments (n.s, not significant; **P < 0.01).
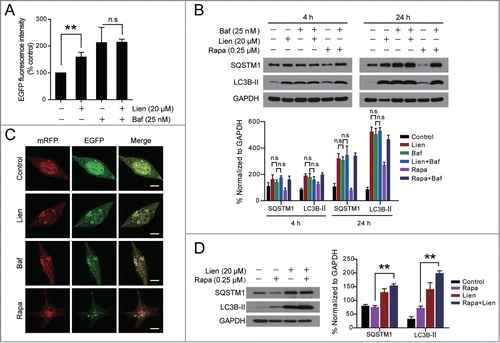
Figure 2. Liensinine inhibits autophagic degradation in MDA-MB-231 cells. (A) MDA-MB-231 cells stably expressing EGFP-LC3 were treated without or with Lien (20 μM) in the presence or absence of 25 nM Baf for 24 h, and total EGFP intensity was measured by flow cytometry. Data are presented as mean ± SD from 3 independent experiments (n.s, not significant, **P < 0.01). (B) Cells were treated without or with Lien (20 μM), or Rapa (0.25 μM) in the presence or absence of 25 nM Baf for 4 h or 24 h; the expression of SQSTM1 and LC3B-II was analyzed by western blot. (C) Cells were transfected with a tandem reporter construct (tfLC3), and were exposed to Lien (20 µM), Baf (20 nM) and Rapa (0.25 μM) as indicated. The colocalization of EGFP and mRFP-LC3 puncta was examined by confocal microscopy. Scale bars: 10 μm. (D) Cells were treated without or with Rapa (0.25 μM) in the presence or absence of 20 μM Lien for 24 h, the expression of SQSTM1 and LC3B-II was analyzed by western blot. Comparisons of the intensities were statistically estimated and represented as mean ± SD for 3 independent experiments (n.s, not significant; **P < 0.01).

Figure 3. Liensinine blocks autophagosome-lysosome fusion by preventing RAB7A recruitment to lysosomes. (A) MDA-MB-231 cells were transiently transfected with EGFP-LC3 and treated with vehicle, Lien (20 µM), Baf (20 nM) or Rapa (0.25 μM) for 24 h. The fluorescent signals were detected by confocal microscopy after staining with LysoTracker Red. Scale bars: 10 µm. (B) Cells cotransfected with LAMP1-mGFP and mRFP-LC3, were treated and detected for fluorescent signals as in (A). Scale bars: 10 µm. (C) Cells were treated without or with 20 μM Lien for different time intervals as indicated; the expression of LAMP2 and RAB7A in whole cell lysates were determined by western blot. The intensities of band normalization to GAPDH is represented as mean ± SD for 3 independent experiments. (D and E) Cells were treated without or with Lien (20 µM) or Rapa (0.25 µM) for 24 h, whole cell lysate was prepared and subjected to immunoprecipitation using anti-LAMP1 (left panel) or anti-RAB7A (right panel), and the associated LC3B-I/LC3B-II, RAB7A, and LAMP1 were determined using immunoblotting. (F and G) The representative images of MDA-MB-231 cells stained for RAB7A (green), LAMP1 (red) or transfected with mRFP-LC3 after treating with Lien (20 µM) or Rapa (0.25 µM) for 24 h. The Pearson's correlation coefficient (Rr) of RAB7A and LAMP1 or mRFP-LC3 colocalization were represented as mean ± SD (n.s, not significant; *P < 0.05; **P < 0.01), 50 cells. Scale bars: 10 μm.
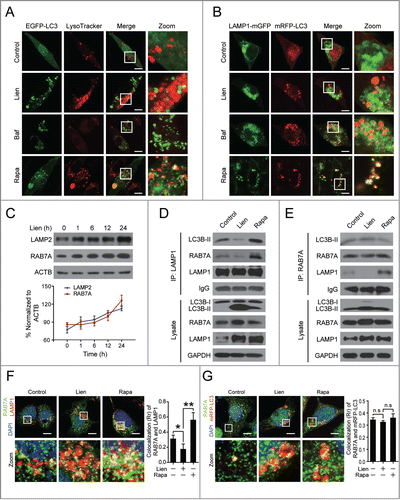
Figure 3. Liensinine blocks autophagosome-lysosome fusion by preventing RAB7A recruitment to lysosomes. (A) MDA-MB-231 cells were transiently transfected with EGFP-LC3 and treated with vehicle, Lien (20 µM), Baf (20 nM) or Rapa (0.25 μM) for 24 h. The fluorescent signals were detected by confocal microscopy after staining with LysoTracker Red. Scale bars: 10 µm. (B) Cells cotransfected with LAMP1-mGFP and mRFP-LC3, were treated and detected for fluorescent signals as in (A). Scale bars: 10 µm. (C) Cells were treated without or with 20 μM Lien for different time intervals as indicated; the expression of LAMP2 and RAB7A in whole cell lysates were determined by western blot. The intensities of band normalization to GAPDH is represented as mean ± SD for 3 independent experiments. (D and E) Cells were treated without or with Lien (20 µM) or Rapa (0.25 µM) for 24 h, whole cell lysate was prepared and subjected to immunoprecipitation using anti-LAMP1 (left panel) or anti-RAB7A (right panel), and the associated LC3B-I/LC3B-II, RAB7A, and LAMP1 were determined using immunoblotting. (F and G) The representative images of MDA-MB-231 cells stained for RAB7A (green), LAMP1 (red) or transfected with mRFP-LC3 after treating with Lien (20 µM) or Rapa (0.25 µM) for 24 h. The Pearson's correlation coefficient (Rr) of RAB7A and LAMP1 or mRFP-LC3 colocalization were represented as mean ± SD (n.s, not significant; *P < 0.05; **P < 0.01), 50 cells. Scale bars: 10 μm.

Figure 4. Liensinine blocks cathepsin maturation without alteration of lysosomal pH. (A and B) MDA-MB-231 cells were treated without or with various concentrations of Lien or Rapa (0.25 µM) for 24 h, total cellular extracts were prepared and subjected to western blot using antibodies against CTSB, CTSD and CTSL. Quantification represents the relative protein levels of the cells normalized to GAPDH (mean ± SD for 3 independent experiments). (C) MDA-MB-231 cells were treated without or with Lien (20 µM) or Baf (25 nM) for 24 h, after which cells were stained with acridine orange and analyzed by flow cytometry. The quantification shows the relative fluorescence intensity ratio normalized to control (mean ± SD for 3 independent experiments; **P < 0.01). (D) MDA-MB-231 cells were treated without or with Lien (20 µM) or Baf (25 nM) for 24 h, and stained with LysoSensor Yellow/Blue DND-160 (1 µM) for 5 min; the fluorescence of live cells was detected by confocal microscopy exciting at 365 nm, and the overlays of the blue (450 nm), and green (510 nm) fluorescence and bright field (DIC) of each treatment are shown. Scale bars: 10 μm. (E) MDA-MB-231 cells were treated without or with Lien (20 µM) or Baf (25 nM) for 24 h; the pH in lysosome was determined by using LysoSensor Yellow/Blue DND-160 staining and a microreader. (F) Confocal microscopy images of MDA-MB-231 cells immunostained for CTSD (green) and LAMP1 (red) after treatment with Lien (20 μM) or Rapa (0.25 µM). The average Pearson's correlation coefficient of CTSD and LAMP1 colocalization are marked. Scale bars: 10 μm.
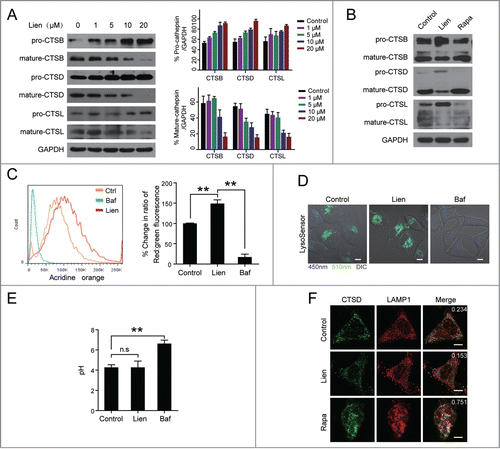
Figure 4. Liensinine blocks cathepsin maturation without alteration of lysosomal pH. (A and B) MDA-MB-231 cells were treated without or with various concentrations of Lien or Rapa (0.25 µM) for 24 h, total cellular extracts were prepared and subjected to western blot using antibodies against CTSB, CTSD and CTSL. Quantification represents the relative protein levels of the cells normalized to GAPDH (mean ± SD for 3 independent experiments). (C) MDA-MB-231 cells were treated without or with Lien (20 µM) or Baf (25 nM) for 24 h, after which cells were stained with acridine orange and analyzed by flow cytometry. The quantification shows the relative fluorescence intensity ratio normalized to control (mean ± SD for 3 independent experiments; **P < 0.01). (D) MDA-MB-231 cells were treated without or with Lien (20 µM) or Baf (25 nM) for 24 h, and stained with LysoSensor Yellow/Blue DND-160 (1 µM) for 5 min; the fluorescence of live cells was detected by confocal microscopy exciting at 365 nm, and the overlays of the blue (450 nm), and green (510 nm) fluorescence and bright field (DIC) of each treatment are shown. Scale bars: 10 μm. (E) MDA-MB-231 cells were treated without or with Lien (20 µM) or Baf (25 nM) for 24 h; the pH in lysosome was determined by using LysoSensor Yellow/Blue DND-160 staining and a microreader. (F) Confocal microscopy images of MDA-MB-231 cells immunostained for CTSD (green) and LAMP1 (red) after treatment with Lien (20 μM) or Rapa (0.25 µM). The average Pearson's correlation coefficient of CTSD and LAMP1 colocalization are marked. Scale bars: 10 μm.

Figure 5. Liensinine sensitizes to a variety of anticancer drug-induced cell death in MDA-MB-231 and MCF-7 cells. (A) MDA-MB-231 and MCF-7 cells were treated with various concentrations of doxorubicin (Dox), paclitaxel, vincristine, cisplatin (CDDP), and staurosporine (STS) in the presence or absence of 20 μM Lien for 48 h, and MTT assays were performed to assess cell proliferation. (B) Cells were treated with increasing doses of Dox in the presence or absence of chloroquine (CQ, 20 μM), Baf (25 nM) or Lien (20 μM) for 48 h, and cell proliferation were measured by MTT assay (mean ± SD for 3 independent experiments; **P < 0.01, n.s, not significant). (C) Cells were cotreated with 20 μM Lien and Dox (0.2 μM for MDA-MB-231 and 0.4 μM for MCF-7 cells) for 48 h, and apoptosis was determined by ANXA5-FITC/PI staining and flow cytometry (mean ± SD for 3 independent experiments; **P < 0.01 compared with control or Lien and Dox treatment alone). (D) Cells were treated as in (C), total cellular extract and cytosol fractions were prepared and subjected to western blot using antibodies against PARP1, cleaved-CASP9 (C-CASP9), cleaved-CASP3 (C-CASP3), and CYCS/cytochrome c (cytosol fraction).
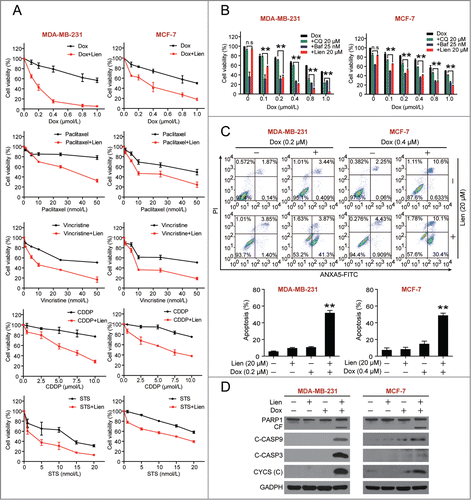
Figure 5. Liensinine sensitizes to a variety of anticancer drug-induced cell death in MDA-MB-231 and MCF-7 cells. (A) MDA-MB-231 and MCF-7 cells were treated with various concentrations of doxorubicin (Dox), paclitaxel, vincristine, cisplatin (CDDP), and staurosporine (STS) in the presence or absence of 20 μM Lien for 48 h, and MTT assays were performed to assess cell proliferation. (B) Cells were treated with increasing doses of Dox in the presence or absence of chloroquine (CQ, 20 μM), Baf (25 nM) or Lien (20 μM) for 48 h, and cell proliferation were measured by MTT assay (mean ± SD for 3 independent experiments; **P < 0.01, n.s, not significant). (C) Cells were cotreated with 20 μM Lien and Dox (0.2 μM for MDA-MB-231 and 0.4 μM for MCF-7 cells) for 48 h, and apoptosis was determined by ANXA5-FITC/PI staining and flow cytometry (mean ± SD for 3 independent experiments; **P < 0.01 compared with control or Lien and Dox treatment alone). (D) Cells were treated as in (C), total cellular extract and cytosol fractions were prepared and subjected to western blot using antibodies against PARP1, cleaved-CASP9 (C-CASP9), cleaved-CASP3 (C-CASP3), and CYCS/cytochrome c (cytosol fraction).

Figure 6. Excessive accumulation of autophagosomes/mitophagosomes mediated by combination of liensinine and doxorubicin in MDA-MB-231 cells. (A) Cells were treated with vehicle, Lien (20 μM), Dox (0.2 μM) alone or combined treated with Lien and Dox for 48 h; whole cell lysates (WCL) and mitochondrial fractions (Mito) were prepared and subjected to western blot using antibodies against LC3B-II, SQSTM1, ubiquitin (Ub), HSPD1, TOMM20, COX4I1, and ACTB. (B) Representative TEM images of cells treated as in (A), N, nucleus; M, mitochondria; red arrows indicates autophagic vacuoles. Scale bars: 2 μm. (C) Cells were transiently cotransfected with RFP-mito and EGFP-LC3 then treated indicated as in (A), and fluorescence images were determined by confocal microscopy. Scale bars: 10 μm. (D and E) Quantification of EGFP-LC3 puncta, RFP-mito and EGFP-LC3 colocalization puncta in 50 cells of 3 independent experiments. (mean ± SD **P < 0.01 compared with Lien treatment alone).
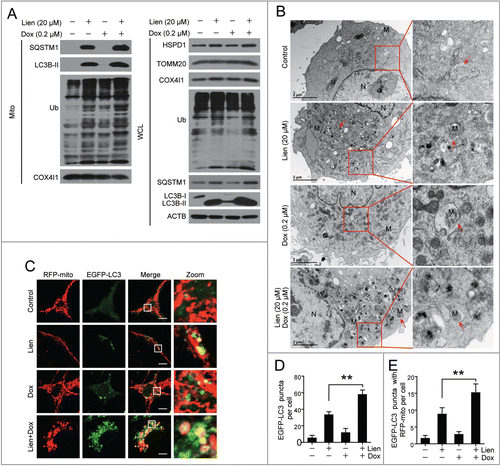
Figure 6. Excessive accumulation of autophagosomes/mitophagosomes mediated by combination of liensinine and doxorubicin in MDA-MB-231 cells. (A) Cells were treated with vehicle, Lien (20 μM), Dox (0.2 μM) alone or combined treated with Lien and Dox for 48 h; whole cell lysates (WCL) and mitochondrial fractions (Mito) were prepared and subjected to western blot using antibodies against LC3B-II, SQSTM1, ubiquitin (Ub), HSPD1, TOMM20, COX4I1, and ACTB. (B) Representative TEM images of cells treated as in (A), N, nucleus; M, mitochondria; red arrows indicates autophagic vacuoles. Scale bars: 2 μm. (C) Cells were transiently cotransfected with RFP-mito and EGFP-LC3 then treated indicated as in (A), and fluorescence images were determined by confocal microscopy. Scale bars: 10 μm. (D and E) Quantification of EGFP-LC3 puncta, RFP-mito and EGFP-LC3 colocalization puncta in 50 cells of 3 independent experiments. (mean ± SD **P < 0.01 compared with Lien treatment alone).

Figure 7. Autophagic inhibition combined with doxorubicin induces mitochondrial fission via dephosphorylation and mitochondrial translocation of DNM1L. (A and D) MDA-MB-231 cells were treated with vehicle, Lien (20 μM), Dox (0.2 μM) alone, or combined treated with Lien plus Dox, CQ plus Dox, and Baf plus Dox for 48 h; mitochondrial morphology was observed by MitoTracker Red CMXRos staining and confocal microscopy. Scale bars: 10 μm in (A) and 20 μm in (D). (B and C) Mitochondrial length and percentage of cells with mitochondrial fragmentation were measured with ImageJ software. 50 cells of 3 independent experiments (mean ± SD *P < 0.05, **P < 0.01 compared with vehicle treatment alone). (E) After treatment in (A), whole cell lysates (WCL), mitochondrial (Mito) and cytosolic (Cyto) fractions were prepared and subjected to western blot using antibodies against DNM1L, and p-DNM1L (Ser616 or Ser637). (F) Cells were exposed to Lien, CQ, and Baf in the presence or absence of Dox for 48 h; WCL, Mito, and Cyto fractions were prepared and subjected to western blot using antibodies as indicated. (G) After treatment in (A), cells were double stained with MitoTracker Red and DNM1L (Alexa Fluor 647, green). Fluorescence images were collected using confocal microscopy. The average Pearson's correlation coefficient of MitoTracker Red and DNM1L colocalization are marked. Scale bars: 10 μm.
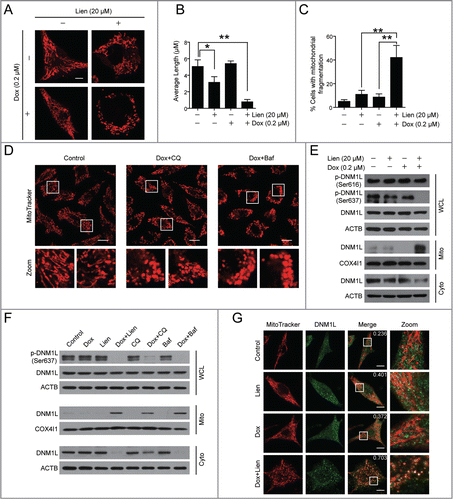
Figure 7. Autophagic inhibition combined with doxorubicin induces mitochondrial fission via dephosphorylation and mitochondrial translocation of DNM1L. (A and D) MDA-MB-231 cells were treated with vehicle, Lien (20 μM), Dox (0.2 μM) alone, or combined treated with Lien plus Dox, CQ plus Dox, and Baf plus Dox for 48 h; mitochondrial morphology was observed by MitoTracker Red CMXRos staining and confocal microscopy. Scale bars: 10 μm in (A) and 20 μm in (D). (B and C) Mitochondrial length and percentage of cells with mitochondrial fragmentation were measured with ImageJ software. 50 cells of 3 independent experiments (mean ± SD *P < 0.05, **P < 0.01 compared with vehicle treatment alone). (E) After treatment in (A), whole cell lysates (WCL), mitochondrial (Mito) and cytosolic (Cyto) fractions were prepared and subjected to western blot using antibodies against DNM1L, and p-DNM1L (Ser616 or Ser637). (F) Cells were exposed to Lien, CQ, and Baf in the presence or absence of Dox for 48 h; WCL, Mito, and Cyto fractions were prepared and subjected to western blot using antibodies as indicated. (G) After treatment in (A), cells were double stained with MitoTracker Red and DNM1L (Alexa Fluor 647, green). Fluorescence images were collected using confocal microscopy. The average Pearson's correlation coefficient of MitoTracker Red and DNM1L colocalization are marked. Scale bars: 10 μm.

Figure 8 (See previous page). Pharmacological or genetic inhibition of DNM1L blocks mitochondrial fission and apoptosis induced by liensinine in combination with doxorubicin. (A) MDA-MB-231 cells were co-exposed to Lien (20 μM) and Dox (0.2 μM) in the presence or absence of Mdivi-1 (10 μM) for 48 h; whole cell lysates (WCL), cytosol fractions (Cyto) and mitochondrial fractions (Mito) were prepared and subjected to western blot analysis. (B) Cell were treated as indicated in (A), and the intracellular localization of TOMM20 (red), DNM1L (green), EGFP-LC3 and RFP-mito were evaluated by immunofluorescence confocal microscopy. Scale bars: 10 μm. (C) Quantification of colocalization of puncta of EGFP-LC3 with RFP-mito and average mitochondrial length. 50 cells were counted in 3 independent experiments (mean ± SD **P < 0.01). (D) Cells were treated as indicated in (A), apoptosis were evaluated by flow cytometry (mean ± SD **P < 0.01), and the expression of C-CASP3 and CYCS (cytosol fraction) were determined by western blot. (E) MDA-MB-231 cells were transfected with control siRNA (Sc-siRNA) and DNM1L siRNA; the expression of DNM1L was determined by western blot. (F) After combined treatment with Lien (20 μM) and Dox (0.2 μM), WCL and Mito fractions were prepared and subjected to western blot using antibodies against LC3B-I/LC3B-II and SQSTM1. (G) The localization of TOMM20 (red) and DNM1L (green), or RFP-mito and EGFP-LC3 in cells treated indicated as in (F). Scale bars: 10 μm. (H) Quantification of average mitochondrial length and the colocalization of puncta corresponding to EGFP-LC3 and RFP-mito. 50 cells were counted in 3 independent experiments (mean ± SD **P < 0.01). (I) Treatment indicated as in (F); apoptosis was determined by flow cytometry (mean ± SD **P < 0.01), and the expression of C-CASP3 and CYCS (cytosol fraction) were determined by western blot. (J) MDA-MB-231 cells transfected with DNM1LWT-mCherry, DNM1LS637A-mCherry and DNM1LS637D-mCherry were treated without or with doxorubicin (0.2 μM) in the presence or absence of liensinine (20 μM), western blot was used to detect DNM1L, p-DNM1L (Ser 637), C-CASP3 in whole cell lysate and CYCS in cytosol fractions. Apoptosis was determined by ANXA5-FITC/PI staining and flow cytometry (mean ± SD for 3 independent experiments; *P < 0.05, **P < 0.01).
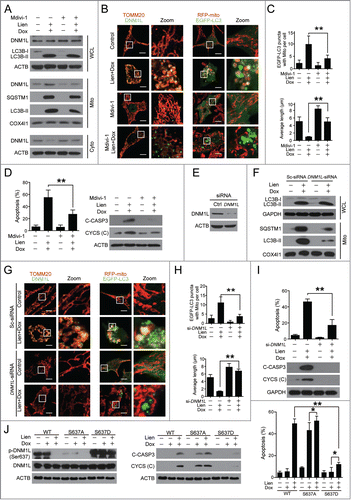
Figure 8 (See previous page). Pharmacological or genetic inhibition of DNM1L blocks mitochondrial fission and apoptosis induced by liensinine in combination with doxorubicin. (A) MDA-MB-231 cells were co-exposed to Lien (20 μM) and Dox (0.2 μM) in the presence or absence of Mdivi-1 (10 μM) for 48 h; whole cell lysates (WCL), cytosol fractions (Cyto) and mitochondrial fractions (Mito) were prepared and subjected to western blot analysis. (B) Cell were treated as indicated in (A), and the intracellular localization of TOMM20 (red), DNM1L (green), EGFP-LC3 and RFP-mito were evaluated by immunofluorescence confocal microscopy. Scale bars: 10 μm. (C) Quantification of colocalization of puncta of EGFP-LC3 with RFP-mito and average mitochondrial length. 50 cells were counted in 3 independent experiments (mean ± SD **P < 0.01). (D) Cells were treated as indicated in (A), apoptosis were evaluated by flow cytometry (mean ± SD **P < 0.01), and the expression of C-CASP3 and CYCS (cytosol fraction) were determined by western blot. (E) MDA-MB-231 cells were transfected with control siRNA (Sc-siRNA) and DNM1L siRNA; the expression of DNM1L was determined by western blot. (F) After combined treatment with Lien (20 μM) and Dox (0.2 μM), WCL and Mito fractions were prepared and subjected to western blot using antibodies against LC3B-I/LC3B-II and SQSTM1. (G) The localization of TOMM20 (red) and DNM1L (green), or RFP-mito and EGFP-LC3 in cells treated indicated as in (F). Scale bars: 10 μm. (H) Quantification of average mitochondrial length and the colocalization of puncta corresponding to EGFP-LC3 and RFP-mito. 50 cells were counted in 3 independent experiments (mean ± SD **P < 0.01). (I) Treatment indicated as in (F); apoptosis was determined by flow cytometry (mean ± SD **P < 0.01), and the expression of C-CASP3 and CYCS (cytosol fraction) were determined by western blot. (J) MDA-MB-231 cells transfected with DNM1LWT-mCherry, DNM1LS637A-mCherry and DNM1LS637D-mCherry were treated without or with doxorubicin (0.2 μM) in the presence or absence of liensinine (20 μM), western blot was used to detect DNM1L, p-DNM1L (Ser 637), C-CASP3 in whole cell lysate and CYCS in cytosol fractions. Apoptosis was determined by ANXA5-FITC/PI staining and flow cytometry (mean ± SD for 3 independent experiments; *P < 0.05, **P < 0.01).

Figure 9 (See previous page). Autophagosome/mitophagosome accumulation contributed to the combination effect of liensinine and doxorubicin. MDA-MB-231 cells were co-exposed to Lien (20 μM) and Dox (0.2 μM) in the presence or absence of 3-MA (5 mM) for 48 h. (A) Whole cell lysate (WCL), cytosolic fractions (Cyto) and mitochondrial fractions (Mito) were prepared and subjected to western blot analysis. (B) The intracellular localization of EGFP-LC3 and RFP-mito were evaluated by confocal microscopy. Scale bars: 10 μm. The EGFP-LC3 puncta and EGFP-LC3 puncta with mitochondria were counted and presented as mean ± SD **P < 0.01. (C) The colocalization and Pearson's correlation coefficient (Rr) of TOMM20 (red) and DNM1L (green) treated as in (A). Scale bars: 10 μm. (D) Quantification of average mitochondrial length; 50 cells were counted in 3 independent experiments (mean ± SD **P < 0.01). (E) Apoptosis was determined by flow cytometry (mean ± SD **P < 0.01), and the expression of C-CASP 3 and CYCS (cytosol fraction) were detected by western blot. (F) MDA-MB-231 cells stably expressing Scramble-siRNA (si-Sc), ATG5-siRNA (si-ATG5) and ATG7-siRNA (si-ATG7) were cotreated without or with Lien (20 μM) and Dox (0.2 μM), WCL, Mito and Cyto fractions were prepared and subjected to western blot. (G) The localization of RFP-mito and EGFP-LC3 were evaluated by confocal microscopy. Scale bars: 10 μm. The EGFP-LC3 puncta and colocalization of puncta were counted and presented as mean ± SD **P < 0.01. (H) The colocalization and Rr of TOMM20 (red) and DNM1L (green) treated as in (F). Scale bars: 10 μm. (I) Quantification of average mitochondrial length. 50 cells were counted in 3 independent experiments (mean ± SD **P < 0.01). (J) Apoptosis was determined by flow cytometry (mean ± SD **P < 0.01), and the expression of C-CASP 3 and CYCS (cytosol fraction) were determined by western blot.
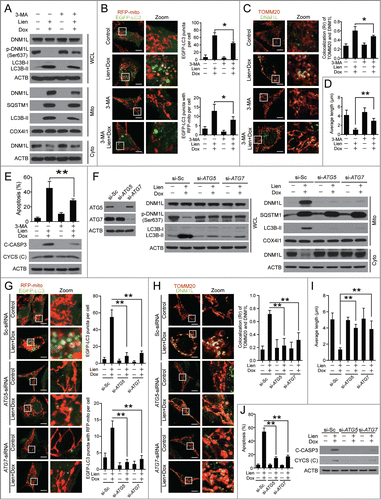
Figure 9 (See previous page). Autophagosome/mitophagosome accumulation contributed to the combination effect of liensinine and doxorubicin. MDA-MB-231 cells were co-exposed to Lien (20 μM) and Dox (0.2 μM) in the presence or absence of 3-MA (5 mM) for 48 h. (A) Whole cell lysate (WCL), cytosolic fractions (Cyto) and mitochondrial fractions (Mito) were prepared and subjected to western blot analysis. (B) The intracellular localization of EGFP-LC3 and RFP-mito were evaluated by confocal microscopy. Scale bars: 10 μm. The EGFP-LC3 puncta and EGFP-LC3 puncta with mitochondria were counted and presented as mean ± SD **P < 0.01. (C) The colocalization and Pearson's correlation coefficient (Rr) of TOMM20 (red) and DNM1L (green) treated as in (A). Scale bars: 10 μm. (D) Quantification of average mitochondrial length; 50 cells were counted in 3 independent experiments (mean ± SD **P < 0.01). (E) Apoptosis was determined by flow cytometry (mean ± SD **P < 0.01), and the expression of C-CASP 3 and CYCS (cytosol fraction) were detected by western blot. (F) MDA-MB-231 cells stably expressing Scramble-siRNA (si-Sc), ATG5-siRNA (si-ATG5) and ATG7-siRNA (si-ATG7) were cotreated without or with Lien (20 μM) and Dox (0.2 μM), WCL, Mito and Cyto fractions were prepared and subjected to western blot. (G) The localization of RFP-mito and EGFP-LC3 were evaluated by confocal microscopy. Scale bars: 10 μm. The EGFP-LC3 puncta and colocalization of puncta were counted and presented as mean ± SD **P < 0.01. (H) The colocalization and Rr of TOMM20 (red) and DNM1L (green) treated as in (F). Scale bars: 10 μm. (I) Quantification of average mitochondrial length. 50 cells were counted in 3 independent experiments (mean ± SD **P < 0.01). (J) Apoptosis was determined by flow cytometry (mean ± SD **P < 0.01), and the expression of C-CASP 3 and CYCS (cytosol fraction) were determined by western blot.

Figure 10. The combination of liensinine and doxorubicin inhibits tumor growth in a MDA-MB-231 mouse xenograft model. (A) Average tumor volume in vehicle control mice, mice treated with Lien (60 mg/kg) or Dox (2 mg/kg) or a combination of Lien and Dox. Error bars represent means ± SD. **P < 0.01 compared with control, Lien or Dox alone. (B) Body weight changes of mice during 30 d of exposure. Statistical analysis of body weight changes showed no significant differences between combination of Lien with Dox and other groups including control, Lien or Dox treatment alone. (C) Tumor tissues were sectioned and subjected to H&E staining, TUNEL assay, and immunohistochemistry for evaluating histological morphology, apoptosis and expression of C-CASP3. Scale bars: 50 μm. (D) and (E) Tumor tissues were sectioned and subjected to immunofluorescence staining for determination of the colocalization of LC3 and HSPD1, or DNM1L and TOMM20 by confocal microscopy. The average Pearson's correlation coefficient of LC3 and HSPD1, or DNM1L and TOMM20 colocalization are marked. Scale bars: 50 μm.
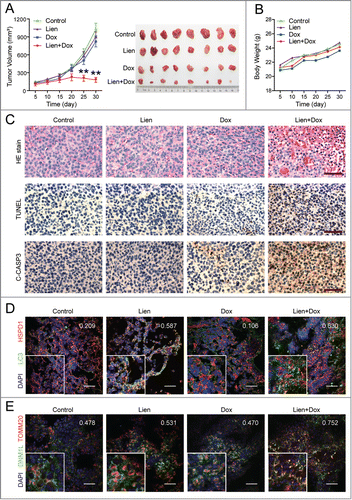
Figure 10. The combination of liensinine and doxorubicin inhibits tumor growth in a MDA-MB-231 mouse xenograft model. (A) Average tumor volume in vehicle control mice, mice treated with Lien (60 mg/kg) or Dox (2 mg/kg) or a combination of Lien and Dox. Error bars represent means ± SD. **P < 0.01 compared with control, Lien or Dox alone. (B) Body weight changes of mice during 30 d of exposure. Statistical analysis of body weight changes showed no significant differences between combination of Lien with Dox and other groups including control, Lien or Dox treatment alone. (C) Tumor tissues were sectioned and subjected to H&E staining, TUNEL assay, and immunohistochemistry for evaluating histological morphology, apoptosis and expression of C-CASP3. Scale bars: 50 μm. (D) and (E) Tumor tissues were sectioned and subjected to immunofluorescence staining for determination of the colocalization of LC3 and HSPD1, or DNM1L and TOMM20 by confocal microscopy. The average Pearson's correlation coefficient of LC3 and HSPD1, or DNM1L and TOMM20 colocalization are marked. Scale bars: 50 μm.

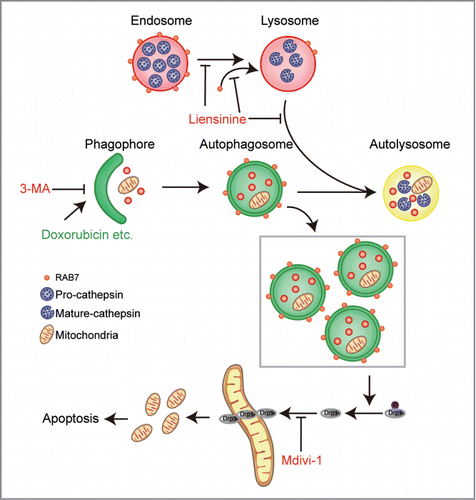
Figure 11. The proposed mechanisms of liensinine-inhibited autophagy and the synergistic effects of liensinine and chemotherapeutic agents.

Figure 11. The proposed mechanisms of liensinine-inhibited autophagy and the synergistic effects of liensinine and chemotherapeutic agents.
Supplemental material

1056970_supplemental_files.doc

Download MS Word (1 MB)

Reprints and Corporate Permissions

Please note: Selecting permissions does not provide access to the full text of the article, please see our help page How do I view content?

To request a reprint or corporate permissions for this article, please click on the relevant link below:

Academic Permissions

Please note: Selecting permissions does not provide access to the full text of the article, please see our help page How do I view content?

Obtain permissions instantly via Rightslink by clicking on the button below:

If you are unable to obtain permissions via Rightslink, please complete and submit this Permissions form. For more information, please visit our Permissions help page.