2,103
Views
21
CrossRef citations to date
0
Altmetric
Basic Research Paper

Evolutionary trends and functional anatomy of the human expanded autophagy network

, , , , , , , , , & show all
Pages 1652-1667 | Received 13 May 2014, Accepted 03 Jun 2015, Published online: 18 Sep 2015

Figures & data

Figure 1. Overview of AXAN and its subnetworks. (A, B) Overview of the Annotated eXpanded Autophagy Network (AXAN) displaying autophagy core (green), signaling (blue), receptors (black) and mediators (gray), as well as additional genes (small gray circles). Gray edges: protein-protein interactions (light: medium confidence; dark: high confidence); red edges: transcriptional regulation. Singleton genes and pairwise gene interactions are displayed at the bottom. For simplicity, only edges between prime genes are displayed in (B). (C) Quantitative network parameters of AXAN, randomized versions of AXAN (rand.AXANs) and 3 random human networks of similar size. (D) Cell type-specific expression of autophagy prime genes. The bar graph displays the percentage over-representation of prime genes expressed in given cell types as compared to random nonautophagy genes. *, P < 0.05; **, P < 0.01; n.s., not significant. (E) Prime gene interaction network. All AXAN prime genes and their interactions are displayed. Node size corresponds to the degree (number of neighbors). The degree distribution across this network and the layout algorithm (spring embedded layout, weighted by edge betweenness) undescores the existence of subregions: Dotted line, spatial separation between autophagy core and signaling domains; red area, protein kinase A subregion; blue, BECN1-UVRAG subregion. (F) The transcription subnetwork within AXAN. Transcription factors (red diamonds) and their target genes within AXAN are displayed. Autophagy prime genes (large circles) are marked by color-coding as described above. Non-prime target genes within AXAN are displayed as small circles.
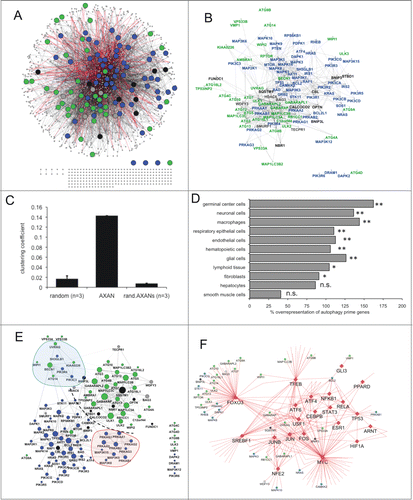
Figure 1. Overview of AXAN and its subnetworks. (A, B) Overview of the Annotated eXpanded Autophagy Network (AXAN) displaying autophagy core (green), signaling (blue), receptors (black) and mediators (gray), as well as additional genes (small gray circles). Gray edges: protein-protein interactions (light: medium confidence; dark: high confidence); red edges: transcriptional regulation. Singleton genes and pairwise gene interactions are displayed at the bottom. For simplicity, only edges between prime genes are displayed in (B). (C) Quantitative network parameters of AXAN, randomized versions of AXAN (rand.AXANs) and 3 random human networks of similar size. (D) Cell type-specific expression of autophagy prime genes. The bar graph displays the percentage over-representation of prime genes expressed in given cell types as compared to random nonautophagy genes. *, P < 0.05; **, P < 0.01; n.s., not significant. (E) Prime gene interaction network. All AXAN prime genes and their interactions are displayed. Node size corresponds to the degree (number of neighbors). The degree distribution across this network and the layout algorithm (spring embedded layout, weighted by edge betweenness) undescores the existence of subregions: Dotted line, spatial separation between autophagy core and signaling domains; red area, protein kinase A subregion; blue, BECN1-UVRAG subregion. (F) The transcription subnetwork within AXAN. Transcription factors (red diamonds) and their target genes within AXAN are displayed. Autophagy prime genes (large circles) are marked by color-coding as described above. Non-prime target genes within AXAN are displayed as small circles.

Figure 2. Evolutionary trends of AXAN prime genes. (A) The evolutionary conservation of human genes from functional categories within AXAN was assessed by ortholog identification in 99 eukaryotic model organisms (and Escherichia coli as outgroup) using the InParanoid7 database. Evolutionary trends were displayed as the percentage of conserved human genes in respective phylogenetic groups. Two thousand randomly chosen human genes served as control (red dotted line). (B) Evolutionary conservation of all 9 human autophagy receptors, 2 core genes, 2 signaling genes and 2 non-AXAN control genes (housekeeping enzyme ALDH9A1 and T cell receptor gene CD3E, marked by asterisks). Gray bars, ortholog in one species within this group; black bars, orthologs in at least 2 species within this group. (C and D) Evolutionary tracks of 2 exemplary AXAN genes (core gene ATG4B and receptor STBD1). Circles represent species, and boxes represent higher order taxonomic groups containing these species. Presence of an ortholog in a given species is visualized by black symbols. For higher groups, coloring displays presence of orthologs in one (gray) or at least 2 (black) species within this group. As examples, the highly conserved autophagy core gene, ATG4B, and the autophagy receptor gene, STBD1, (the most recent autophagy receptor) are displayed.
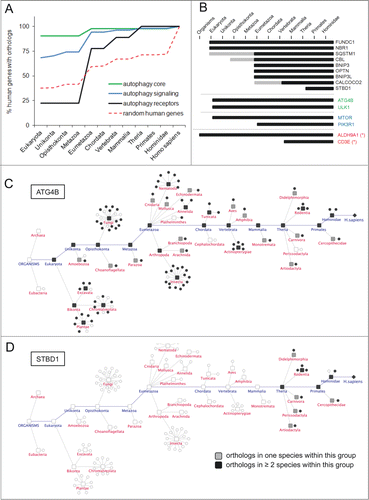
Figure 2. Evolutionary trends of AXAN prime genes. (A) The evolutionary conservation of human genes from functional categories within AXAN was assessed by ortholog identification in 99 eukaryotic model organisms (and Escherichia coli as outgroup) using the InParanoid7 database. Evolutionary trends were displayed as the percentage of conserved human genes in respective phylogenetic groups. Two thousand randomly chosen human genes served as control (red dotted line). (B) Evolutionary conservation of all 9 human autophagy receptors, 2 core genes, 2 signaling genes and 2 non-AXAN control genes (housekeeping enzyme ALDH9A1 and T cell receptor gene CD3E, marked by asterisks). Gray bars, ortholog in one species within this group; black bars, orthologs in at least 2 species within this group. (C and D) Evolutionary tracks of 2 exemplary AXAN genes (core gene ATG4B and receptor STBD1). Circles represent species, and boxes represent higher order taxonomic groups containing these species. Presence of an ortholog in a given species is visualized by black symbols. For higher groups, coloring displays presence of orthologs in one (gray) or at least 2 (black) species within this group. As examples, the highly conserved autophagy core gene, ATG4B, and the autophagy receptor gene, STBD1, (the most recent autophagy receptor) are displayed.

Figure 3. Functional architecture of AXAN. (A) AXAN genes were used to construct a pathway-based functional interaction network (using Reactome database) followed by GLay community clustering for identification of modules. The 21 individual modules are displayed by different colors. (B) The modules were transformed into metanodes with node size corresponding to the number of nodes. Coloring illustrates the fraction of autophagy core (green) and/or signaling (blue) genes. Lead terms were added based on pathway enrichment analysis. The edges between metanodes correspond to interactions between the underlying genes. Modules M05 and M06 are accentuated by bold font. (C) The ‘autophagy’ module (M05). (D) The ‘Insulin & MTOR signaling’ module (M06). In both modules prime genes are displayed according to their category (green, core; blue, signaling). The red dotted lines emphasize existence of smaller functional submodules associated with specific biological functions (see main text).
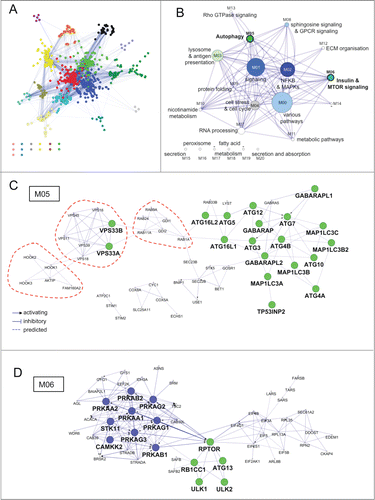
Figure 3. Functional architecture of AXAN. (A) AXAN genes were used to construct a pathway-based functional interaction network (using Reactome database) followed by GLay community clustering for identification of modules. The 21 individual modules are displayed by different colors. (B) The modules were transformed into metanodes with node size corresponding to the number of nodes. Coloring illustrates the fraction of autophagy core (green) and/or signaling (blue) genes. Lead terms were added based on pathway enrichment analysis. The edges between metanodes correspond to interactions between the underlying genes. Modules M05 and M06 are accentuated by bold font. (C) The ‘autophagy’ module (M05). (D) The ‘Insulin & MTOR signaling’ module (M06). In both modules prime genes are displayed according to their category (green, core; blue, signaling). The red dotted lines emphasize existence of smaller functional submodules associated with specific biological functions (see main text).

Figure 4. Functional assessment of network predictions. (A) External linker nodes (diamonds) were introduced to connect hitherto solitary nodes (white circles) to AXAN main network (color coding of prime genes as described above). Only those linker nodes chosen for functional siRNA-screening and their first-degree neighbors are shown. Yellow, candidate linker genes that did not pass all test criteria; red, hit genes from functional screen. (B) Summary of the results from a tripartite image-based siRNA screen aimed to assess the role of linker nodes for autophagy pathways. Three independent assays were used: delivery of the cytosolic RFP-EGFP fusion protein to the lysosome (lysoRG) as a measure of autophagy, quantification of endogenous Lys63/K63-linked ubiquitin (UB-K63) levels and quantification of peroxisomal mass (using CAT/catalase as an endogenous marker) under pexophagy conditions (CT, as a measure of pexophagy). Effect strength is displayed using si-negCTRL normalized values. Purple, gene knockdown decreases autophagy effect; green, knockdown increases effect. Of 17 candidate genes tested, 5 passed 2 of the 3 tests with effects in the same direction (orange), and 4 passed all 3 tests in the same direction (red). CDC42 (marked by asterisk) was chosen for further analyses, based on effect strength, its degree in cAXAN and the number of prime genes among its direct neighbors (NB). (C) Examples of how knockdown of Rho GTPase, CDC42, affects the 3 image-based readouts (Scale bar: 10 μm).
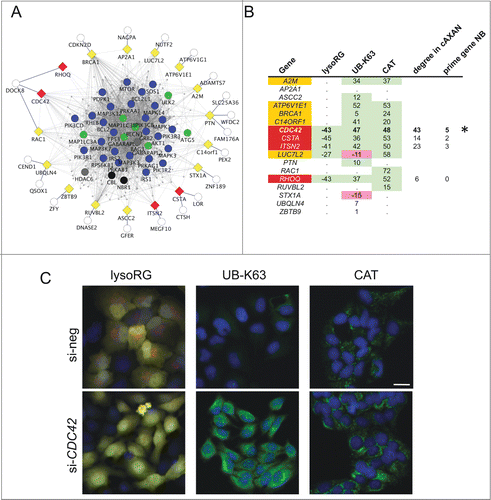
Figure 4. Functional assessment of network predictions. (A) External linker nodes (diamonds) were introduced to connect hitherto solitary nodes (white circles) to AXAN main network (color coding of prime genes as described above). Only those linker nodes chosen for functional siRNA-screening and their first-degree neighbors are shown. Yellow, candidate linker genes that did not pass all test criteria; red, hit genes from functional screen. (B) Summary of the results from a tripartite image-based siRNA screen aimed to assess the role of linker nodes for autophagy pathways. Three independent assays were used: delivery of the cytosolic RFP-EGFP fusion protein to the lysosome (lysoRG) as a measure of autophagy, quantification of endogenous Lys63/K63-linked ubiquitin (UB-K63) levels and quantification of peroxisomal mass (using CAT/catalase as an endogenous marker) under pexophagy conditions (CT, as a measure of pexophagy). Effect strength is displayed using si-negCTRL normalized values. Purple, gene knockdown decreases autophagy effect; green, knockdown increases effect. Of 17 candidate genes tested, 5 passed 2 of the 3 tests with effects in the same direction (orange), and 4 passed all 3 tests in the same direction (red). CDC42 (marked by asterisk) was chosen for further analyses, based on effect strength, its degree in cAXAN and the number of prime genes among its direct neighbors (NB). (C) Examples of how knockdown of Rho GTPase, CDC42, affects the 3 image-based readouts (Scale bar: 10 μm).

Figure 5. Effect of CDC42 on autophagy pathways. (A) Knockdown of CDC42 (or ATG5 as positive control) impairs formation of red-only structures in ptfLC3-transfected Huh7 cells (4 h starvation in EBSS). Colocalization of these structures with lysosomal marker LAMP1 (blue) only appears in cells transfected with negative control siRNA (si-neg). Treatment with lysosome inhibitor bafilomycin A1 (Baf, 20 nM) served as positive control. Scale bar: 5 μm. (B) Knockdown of ATG5 and CDC42 was analyzed by western blotting. ACTB/β-actin served as loading control.
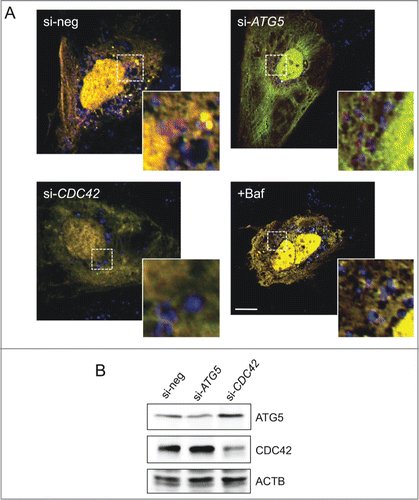
Figure 5. Effect of CDC42 on autophagy pathways. (A) Knockdown of CDC42 (or ATG5 as positive control) impairs formation of red-only structures in ptfLC3-transfected Huh7 cells (4 h starvation in EBSS). Colocalization of these structures with lysosomal marker LAMP1 (blue) only appears in cells transfected with negative control siRNA (si-neg). Treatment with lysosome inhibitor bafilomycin A1 (Baf, 20 nM) served as positive control. Scale bar: 5 μm. (B) Knockdown of ATG5 and CDC42 was analyzed by western blotting. ACTB/β-actin served as loading control.

Figure 6. Functional role of CDC42 on autophagy-associated pathways. (A) Subnetwork of first-degree neighbors of CDC42 within the complemented AXAN (cAXAN). CDC42 (red diamond), prime genes (blue, signaling; black, receptors) and the formerly singleton gene DOCK8 (white) are displayed with large symbols, other AXAN genes with small symbols. (B) Effect of knockdown of ATG7 (control) and CDC42 on signaling pathways induced by autophagy activator rapamycin (Rapa). ACTB/β-actin served as loading control. (C) Effect of knockdown of CDC42 on LC3 abundance and lipidation induced by rapamycin (Rapa) in Huh7 cells.
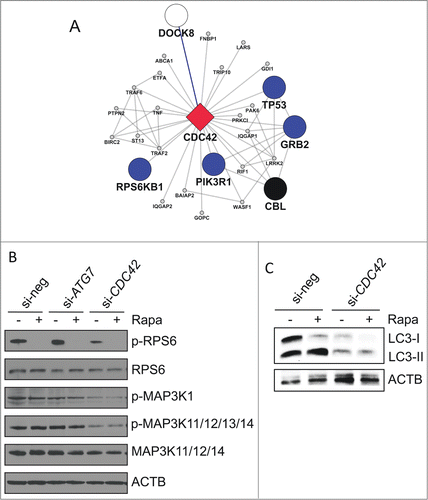
Figure 6. Functional role of CDC42 on autophagy-associated pathways. (A) Subnetwork of first-degree neighbors of CDC42 within the complemented AXAN (cAXAN). CDC42 (red diamond), prime genes (blue, signaling; black, receptors) and the formerly singleton gene DOCK8 (white) are displayed with large symbols, other AXAN genes with small symbols. (B) Effect of knockdown of ATG7 (control) and CDC42 on signaling pathways induced by autophagy activator rapamycin (Rapa). ACTB/β-actin served as loading control. (C) Effect of knockdown of CDC42 on LC3 abundance and lipidation induced by rapamycin (Rapa) in Huh7 cells.
Supplemental material

upplemental_Video_-_1AB.zip

Download Zip (1.4 MB)

Supplemental_Video_-_S2AB.zip

Download Zip (104.6 KB)

Supplemental_Video_-_pAT012_EBSS_7_h.mov

Download QuickTime Video (3.5 MB)

Supplemental_Video_-_6A.zip

Download Zip (34.1 KB)

Supplemental_Video_-_4A.zip

Download Zip (197.8 KB)

Supplemental_Video_-_3_Reactome_FIs.zip

Download Zip (268.7 KB)

Supplemental_Video_-_1F.zip

Download Zip (52.3 KB)

Supplemental_Video_-_1E.zip

Download Zip (80.5 KB)

supplemental_figs_and_tables.zip

Download Zip (10.5 MB)

Reprints and Corporate Permissions

Please note: Selecting permissions does not provide access to the full text of the article, please see our help page How do I view content?

To request a reprint or corporate permissions for this article, please click on the relevant link below:

Academic Permissions

Please note: Selecting permissions does not provide access to the full text of the article, please see our help page How do I view content?

Obtain permissions instantly via Rightslink by clicking on the button below:

If you are unable to obtain permissions via Rightslink, please complete and submit this Permissions form. For more information, please visit our Permissions help page.