2,790
Views
27
CrossRef citations to date
0
Altmetric
BASIC RESEARCH PAPERS

TMBIM6 (transmembrane BAX inhibitor motif containing 6) enhances autophagy and reduces renal dysfunction in a cyclosporine A-induced nephrotoxicity model

, , , , , , , , , , , , , & show all
Pages 1760-1774 | Received 12 Sep 2014, Accepted 07 Aug 2015, Published online: 27 Oct 2015

Figures & data

Figure 1. TMBIM6 increases autophagy in HK-2 cells. (A) NC and TMBIM6 cells were treated with 20 μM CsA for 0, 6, 12, 24, or 48 h. Immunoblotting was performed with anti-LC3-II, SQSTM1, and ACTB antibodies. The lower panel shows the results of densitometric analysis. #P < 0.05 vs. NC cells for each period. Images shown are representative of 3 independent experiments. (B) NC and TMBIM6 cells were treated with 20 μM CsA in the presence or absence of 80 nM bafilomycin for 24 h or 48 h. Immunoblotting was performed with anti-LC3-II, SQSTM1, and ACTB antibodies. The lower panel shows the results of densitometric analysis. *, P < 0.05 vs. NC cells during each period. #, P < 0.05 CsA+Baf vs. CsA during each period. Images shown are representative of 3 independent experiments (C) NC and TMBIM6 cells were transiently transfected with mRFP-GFP-LC3 for 24 h, after which the cells were treated with 20 μM CsA for 24 h. Red and green puncta were visualized by confocal microscopy. The right panel shows quantification of the ratio of mRFP-GFP-LC3 red to yellow puncta. #P < 0.05 vs. NC cells after treatment with CsA. (D) Lysosome and autophagic vacuoles (AVs) were analyzed by electron microscopy in NC and TMBIM6 cells with or without CsA. Results were quantified by counting the number of autophagic vacuoles per slice of view. Representative transmission electron micrographs of cell-in-cell structure showing autophagosomes (black arrow), lysosomes (white arrow), and autolysosomes (white asterisk).#, P < 0.05 vs. TMBIM6 cells after treatment with CsA.
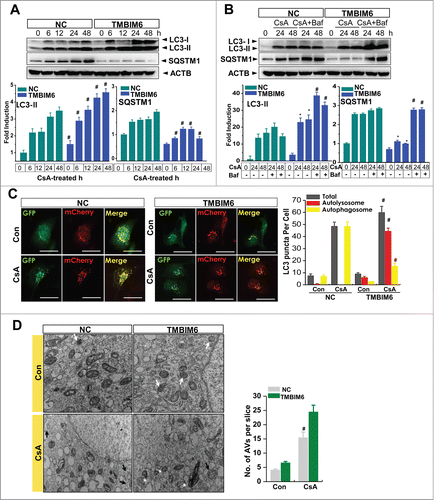
Figure 1. TMBIM6 increases autophagy in HK-2 cells. (A) NC and TMBIM6 cells were treated with 20 μM CsA for 0, 6, 12, 24, or 48 h. Immunoblotting was performed with anti-LC3-II, SQSTM1, and ACTB antibodies. The lower panel shows the results of densitometric analysis. #P < 0.05 vs. NC cells for each period. Images shown are representative of 3 independent experiments. (B) NC and TMBIM6 cells were treated with 20 μM CsA in the presence or absence of 80 nM bafilomycin for 24 h or 48 h. Immunoblotting was performed with anti-LC3-II, SQSTM1, and ACTB antibodies. The lower panel shows the results of densitometric analysis. *, P < 0.05 vs. NC cells during each period. #, P < 0.05 CsA+Baf vs. CsA during each period. Images shown are representative of 3 independent experiments (C) NC and TMBIM6 cells were transiently transfected with mRFP-GFP-LC3 for 24 h, after which the cells were treated with 20 μM CsA for 24 h. Red and green puncta were visualized by confocal microscopy. The right panel shows quantification of the ratio of mRFP-GFP-LC3 red to yellow puncta. #P < 0.05 vs. NC cells after treatment with CsA. (D) Lysosome and autophagic vacuoles (AVs) were analyzed by electron microscopy in NC and TMBIM6 cells with or without CsA. Results were quantified by counting the number of autophagic vacuoles per slice of view. Representative transmission electron micrographs of cell-in-cell structure showing autophagosomes (black arrow), lysosomes (white arrow), and autolysosomes (white asterisk).#, P < 0.05 vs. TMBIM6 cells after treatment with CsA.
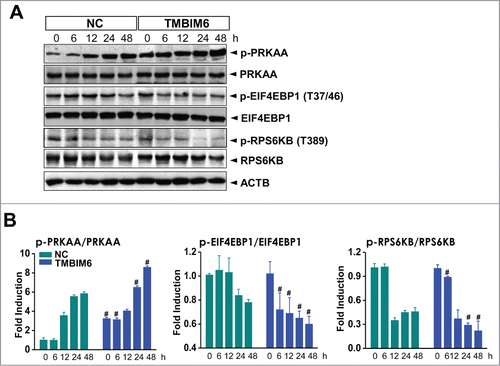
Figure 2. TMBIM6-induced autophagy is associated with inhibition of the MTORC1 pathway and activation of PRKAA in CsA-treated HK-2 cells. (A) Both NC and TMBIM6 cells were treated with 20 μM CsA for 0, 6, 12, 24, or 48 h. Western blotting was performed with p-PRKAA, PRKAA, p- EIF4EBP1, EIF4EBP1, p-RPS6KB, RPS6KB, and ACTB antibodies. (B) Densitometric quantification of selected western blot bands. #, P < 0.05 vs. NC cells for each period. Images shown are representative of 3 independent experiments.

Figure 2. TMBIM6-induced autophagy is associated with inhibition of the MTORC1 pathway and activation of PRKAA in CsA-treated HK-2 cells. (A) Both NC and TMBIM6 cells were treated with 20 μM CsA for 0, 6, 12, 24, or 48 h. Western blotting was performed with p-PRKAA, PRKAA, p- EIF4EBP1, EIF4EBP1, p-RPS6KB, RPS6KB, and ACTB antibodies. (B) Densitometric quantification of selected western blot bands. #, P < 0.05 vs. NC cells for each period. Images shown are representative of 3 independent experiments.

Figure 3. TMBIM6 cells exhibit high lysosomal activity following CsA treatment. (A) NC and TMBIM6 cells were treated with 20 μM CsA for 0, 6, 12, 24, or 48 h. Activities of MAN/α-mannosidase, GLB1/β-galactosidase, and GUSB/β-glucuronidase from lysosomal extracts were measured as described in Materials and Methods. #, P < 0.05 vs. NC cells for each period. Images shown are representative of 3 independent experiments. NC and TMBIM6 cells were treated with 20 μM CsA for 6 h and then exposed to 100 nM LysoTracker (B) or 1 µg/ml acridine orange (C) and photographed. Representative images are shown at × 600 magnification. Fluorescence intensities were quantified (right panel). *, P < 0.05 vs. NC cells without CsA; #, P < 0.05 vs. NC cells treated with CsA. (D) Western blotting was performed with CTSB, LAMP2, and LAMP1 antibodies. Images shown are representative of 3 independent experiments. (E) CTSB activity from lysosomal extracts was measured using a fluorospectrometer. #P < 0.05 vs. NC cells for each period. (F) LAMP2 immunocytochemical staining in NC and TMBIM6 cells treated with or without CsA for 6 h. DAPI was used to counterstain nuclei. Representative images are shown at ×600 magnifications. Fluorescence intensities were quantified (right panel). *, P < 0.05 vs. NC cells without CsA; #, P < 0.05 vs. NC cells treated with CsA.
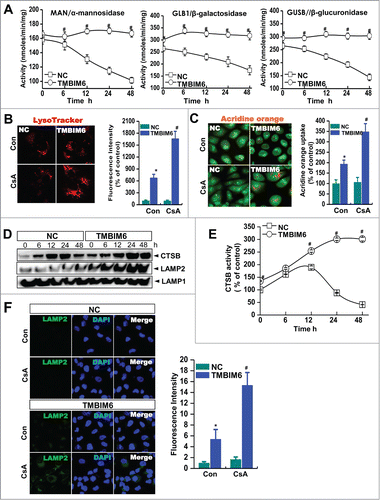
Figure 3. TMBIM6 cells exhibit high lysosomal activity following CsA treatment. (A) NC and TMBIM6 cells were treated with 20 μM CsA for 0, 6, 12, 24, or 48 h. Activities of MAN/α-mannosidase, GLB1/β-galactosidase, and GUSB/β-glucuronidase from lysosomal extracts were measured as described in Materials and Methods. #, P < 0.05 vs. NC cells for each period. Images shown are representative of 3 independent experiments. NC and TMBIM6 cells were treated with 20 μM CsA for 6 h and then exposed to 100 nM LysoTracker (B) or 1 µg/ml acridine orange (C) and photographed. Representative images are shown at × 600 magnification. Fluorescence intensities were quantified (right panel). *, P < 0.05 vs. NC cells without CsA; #, P < 0.05 vs. NC cells treated with CsA. (D) Western blotting was performed with CTSB, LAMP2, and LAMP1 antibodies. Images shown are representative of 3 independent experiments. (E) CTSB activity from lysosomal extracts was measured using a fluorospectrometer. #P < 0.05 vs. NC cells for each period. (F) LAMP2 immunocytochemical staining in NC and TMBIM6 cells treated with or without CsA for 6 h. DAPI was used to counterstain nuclei. Representative images are shown at ×600 magnifications. Fluorescence intensities were quantified (right panel). *, P < 0.05 vs. NC cells without CsA; #, P < 0.05 vs. NC cells treated with CsA.

Figure 4. TMBIM6 induces TFEB activation. (A) TFEB mRNA levels were measured by real-time PCR, #, P < 0.05 vs. NC cells for each period. (B) Western blotting was performed with TFEB, histone (nuclear marker), and TUBB/tubulin (cytosol marker) antibodies. Densitometric quantification of western blot bands is shown in the right panel. #, P < 0.05 vs. NC cells treated with CsA. Cyto, cytosolic fraction; Nu, nuclear fraction. Images shown are representative of 3 independent experiments. (C) TFEB immunocytochemical staining of NC and TMBIM6 cells treated with or without CsA for 6 h. DAPI was used to counterstain nuclei. Representative images are shown at ×600 magnifications. Fluorescence intensities were quantified (right panel). #, P < 0.05 vs. NC cells treated with CsA.
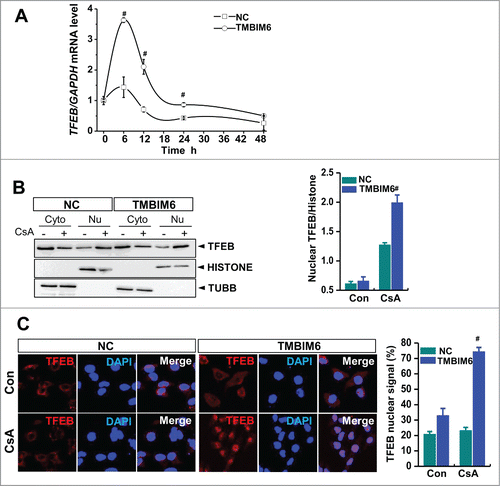
Figure 4. TMBIM6 induces TFEB activation. (A) TFEB mRNA levels were measured by real-time PCR, #, P < 0.05 vs. NC cells for each period. (B) Western blotting was performed with TFEB, histone (nuclear marker), and TUBB/tubulin (cytosol marker) antibodies. Densitometric quantification of western blot bands is shown in the right panel. #, P < 0.05 vs. NC cells treated with CsA. Cyto, cytosolic fraction; Nu, nuclear fraction. Images shown are representative of 3 independent experiments. (C) TFEB immunocytochemical staining of NC and TMBIM6 cells treated with or without CsA for 6 h. DAPI was used to counterstain nuclei. Representative images are shown at ×600 magnifications. Fluorescence intensities were quantified (right panel). #, P < 0.05 vs. NC cells treated with CsA.

Figure 5. Tmbim6-knockout increases CsA-induced kidney injury and ER stress. (A) The mRNA expression of Tmbim6 was examined in whole kidney, renal cortex, and outer and inner medulla. Real-time PCR results from different sections of the kidney indicated that endogenous Tmbim6 mRNA levels were higher in the cortex region than in the outer and inner medullar regions. (B) In situ hybridization (ISH) analysis of Tmbim6, WT mice revealed clusters of brown punctate signals in most of the cells in the cortex and medulla, and signals were strongest in distal and proximal convoluted tubules. ((C)and D) WT mice and tmbim6−/− mice were treated with 15 mg/kg CsA by intraperitoneal injection daily for 30 d, and blood samples were collected for measurements of serum urea and serum creatinine. Each value represents the mean ± SEM of 3 independent experiments. #, P < 0.05 CsA tmbim6−/− mice vs. CsA WT mice. (E) Kidney tissue sections were used for PAS staining. Representative images are shown at × 600 magnification. (F) Immunoblotting of kidney lysates from WT mice and tmbim6−/− mice treated with or without CsA was performed using anti-HSPA5, -DDIT3, and -ACTB antibodies. Densitometric analysis results are shown in the right panel. #, P < 0.05 CsA tmbim6−/− mice vs. CsA WT mice. (G) Sirius Red staining was performed in the kidney tissue section to see the fibrosis.
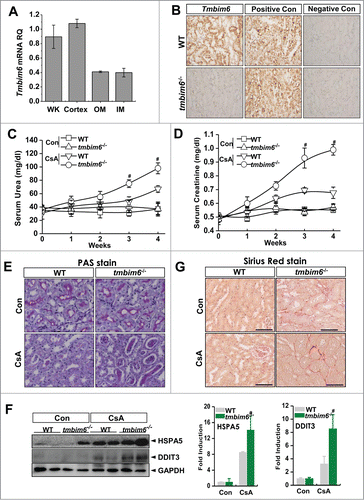
Figure 5. Tmbim6-knockout increases CsA-induced kidney injury and ER stress. (A) The mRNA expression of Tmbim6 was examined in whole kidney, renal cortex, and outer and inner medulla. Real-time PCR results from different sections of the kidney indicated that endogenous Tmbim6 mRNA levels were higher in the cortex region than in the outer and inner medullar regions. (B) In situ hybridization (ISH) analysis of Tmbim6, WT mice revealed clusters of brown punctate signals in most of the cells in the cortex and medulla, and signals were strongest in distal and proximal convoluted tubules. ((C)and D) WT mice and tmbim6−/− mice were treated with 15 mg/kg CsA by intraperitoneal injection daily for 30 d, and blood samples were collected for measurements of serum urea and serum creatinine. Each value represents the mean ± SEM of 3 independent experiments. #, P < 0.05 CsA tmbim6−/− mice vs. CsA WT mice. (E) Kidney tissue sections were used for PAS staining. Representative images are shown at × 600 magnification. (F) Immunoblotting of kidney lysates from WT mice and tmbim6−/− mice treated with or without CsA was performed using anti-HSPA5, -DDIT3, and -ACTB antibodies. Densitometric analysis results are shown in the right panel. #, P < 0.05 CsA tmbim6−/− mice vs. CsA WT mice. (G) Sirius Red staining was performed in the kidney tissue section to see the fibrosis.

Figure 6. TMBIM6 regulates CsA-induced autophagy in mice. (A) Immunoblotting of kidney lysates from WT mice and tmbim6−/− mice treated with or without CsA was performed using anti-LC3-II, -SQSTM1, and -ACTB antibodies. The right panel shows densitometric analysis results. #, P < 0.05 CsA tmbim6−/− mice vs. CsA WT mice. (B) Representative images of GFP-LC3 puncta in kidney tissues of GFP-LC3 WT and GFP-LC3 tmbim6−/− mice treated with or without CsA. GFP puncta were visualized by confocal microscopy. Representative images are shown at × 600 magnifications. (C) Kidney tissue sections were immunostained with an anti-SQSTM1 antibody. Representative images are shown at × 600 magnifications. (D) Lysosomes and autophagic vacuoles (AVs) were analyzed by electron microscopy in WT mice and tmbim6−/− mice treated with or without CsA. Results were quantified by counting the number of autophagic vacuoles per field of view (mean ± SEM of 3 mice per experimental group). Representative transmission electron micrographs of cell-in-cell structure showing autophagosomes (black arrow), lysosomes (white arrow) and autolysosomes (white asterisk). #, P < 0.05 CsA tmbim6−/− mice vs. CsA WT mice.
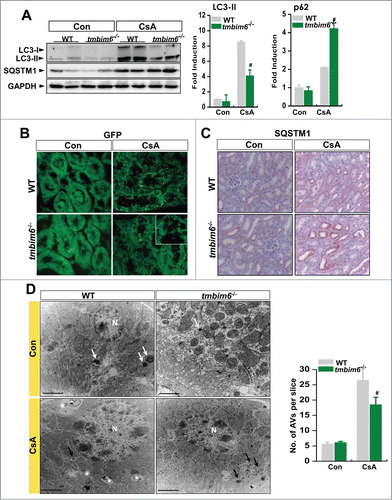
Figure 6. TMBIM6 regulates CsA-induced autophagy in mice. (A) Immunoblotting of kidney lysates from WT mice and tmbim6−/− mice treated with or without CsA was performed using anti-LC3-II, -SQSTM1, and -ACTB antibodies. The right panel shows densitometric analysis results. #, P < 0.05 CsA tmbim6−/− mice vs. CsA WT mice. (B) Representative images of GFP-LC3 puncta in kidney tissues of GFP-LC3 WT and GFP-LC3 tmbim6−/− mice treated with or without CsA. GFP puncta were visualized by confocal microscopy. Representative images are shown at × 600 magnifications. (C) Kidney tissue sections were immunostained with an anti-SQSTM1 antibody. Representative images are shown at × 600 magnifications. (D) Lysosomes and autophagic vacuoles (AVs) were analyzed by electron microscopy in WT mice and tmbim6−/− mice treated with or without CsA. Results were quantified by counting the number of autophagic vacuoles per field of view (mean ± SEM of 3 mice per experimental group). Representative transmission electron micrographs of cell-in-cell structure showing autophagosomes (black arrow), lysosomes (white arrow) and autolysosomes (white asterisk). #, P < 0.05 CsA tmbim6−/− mice vs. CsA WT mice.

Figure 7. TMBIM6 regulates autophagy through the PRKAA-MTORC1 pathway in CsA-treated mice and regulates lysosomal activity. (A) Immunoblotting of kidney lysates from WT mice and tmbim6−/− mice treated with or without CsA was performed using p-PRKAA, PRKAA, p-EIF4EBP1, EIF4EBP1, p-RPS6KB, RPS6K, and ACTB antibodies. The right panel shows the densitometric analysis results. *, P < 0.05 tmbim6−/− mice vs. WT mice; #, P < 0.05 CsA tmbim6−/− mice vs. CsA WT mice. The activities of MAN/α-mannosidase, GLB1/β-galactosidase, and GUSB/β-glucuronidase (B) and CTSB activity (C) from lysosomal extracts were measured. *, P < 0.05 tmbim6−/− mice vs. WT mice; #, P < 0.05 CsA tmbim6−/− mice vs. CsA WT mice. (D) Kidney tissue sections were immunostained with an anti-LAMP2 antibody. Representative images are shown at × 600 magnification. (E) Tfeb mRNA levels were measured by real-time PCR; #, P < 0.05 CsA tmbim6−/− mice vs. CsA WT mice. (F) Western blotting was performed with antibodies to TFEB, histone (nuclear marker), and TUBB/tubulin (cytosol marker). Densitometric quantification of western blot bands is shown (lower). #, P < 0.05 CsA tmbim6−/− mice vs. CsA WT mice. Cyto, cytosolic fraction; Nu, nuclear fraction.
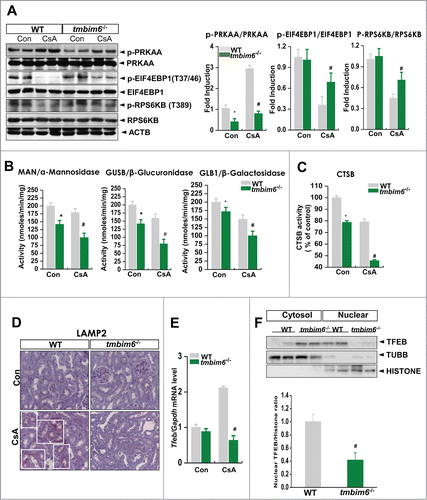
Figure 7. TMBIM6 regulates autophagy through the PRKAA-MTORC1 pathway in CsA-treated mice and regulates lysosomal activity. (A) Immunoblotting of kidney lysates from WT mice and tmbim6−/− mice treated with or without CsA was performed using p-PRKAA, PRKAA, p-EIF4EBP1, EIF4EBP1, p-RPS6KB, RPS6K, and ACTB antibodies. The right panel shows the densitometric analysis results. *, P < 0.05 tmbim6−/− mice vs. WT mice; #, P < 0.05 CsA tmbim6−/− mice vs. CsA WT mice. The activities of MAN/α-mannosidase, GLB1/β-galactosidase, and GUSB/β-glucuronidase (B) and CTSB activity (C) from lysosomal extracts were measured. *, P < 0.05 tmbim6−/− mice vs. WT mice; #, P < 0.05 CsA tmbim6−/− mice vs. CsA WT mice. (D) Kidney tissue sections were immunostained with an anti-LAMP2 antibody. Representative images are shown at × 600 magnification. (E) Tfeb mRNA levels were measured by real-time PCR; #, P < 0.05 CsA tmbim6−/− mice vs. CsA WT mice. (F) Western blotting was performed with antibodies to TFEB, histone (nuclear marker), and TUBB/tubulin (cytosol marker). Densitometric quantification of western blot bands is shown (lower). #, P < 0.05 CsA tmbim6−/− mice vs. CsA WT mice. Cyto, cytosolic fraction; Nu, nuclear fraction.

Figure 8. Proposed mechanism for TMBIM6-induced regulation against CsA-associated autophagy process alteration and renal injury. TMBIM6 protects against CsA toxicity by activating autophagy and enhancing autophagic degradation. TMBIM6 enhances PRKAA phosphorylation, regulates MTORC1 activity and increases TFEB activity. Resultantly, lysosome biogenesis, autolysosome formation, and autophagic flux are stimulated in the presence of TMBIM6, inhibiting CsA-induced autophagosome accumulation and its linked renal injury.
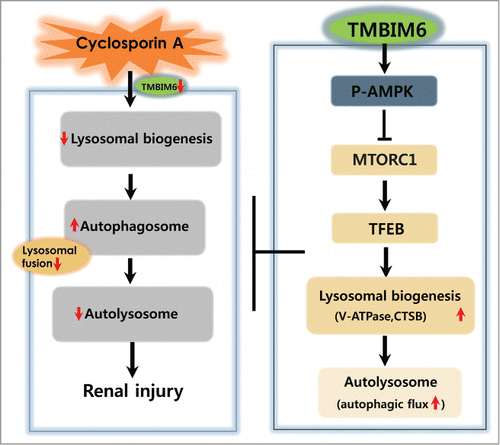
Figure 8. Proposed mechanism for TMBIM6-induced regulation against CsA-associated autophagy process alteration and renal injury. TMBIM6 protects against CsA toxicity by activating autophagy and enhancing autophagic degradation. TMBIM6 enhances PRKAA phosphorylation, regulates MTORC1 activity and increases TFEB activity. Resultantly, lysosome biogenesis, autolysosome formation, and autophagic flux are stimulated in the presence of TMBIM6, inhibiting CsA-induced autophagosome accumulation and its linked renal injury.
Supplemental material

1082021_supplementary_materials_and_methods.pdf

Download PDF (747.5 KB)

Reprints and Corporate Permissions

Please note: Selecting permissions does not provide access to the full text of the article, please see our help page How do I view content?

To request a reprint or corporate permissions for this article, please click on the relevant link below:

Academic Permissions

Please note: Selecting permissions does not provide access to the full text of the article, please see our help page How do I view content?

Obtain permissions instantly via Rightslink by clicking on the button below:

If you are unable to obtain permissions via Rightslink, please complete and submit this Permissions form. For more information, please visit our Permissions help page.