Figures & data
Figure 1. Starvation-induced GFP-LC3 accumulation in the cones. (A-C) Representative confocal images of retinae from 25-wk-old GFP-LC3 transgenic mice. (A) GFP-LC3 mice, No starvation (n = 3 mice per treatment). (B) GFP-LC3 mice, starvation (n = 3 mice per treatment). (C) GFP-LC3 x Atg5ΔCone mice, starvation. GFP-LC3 (green) (n = 3 mice per treatment), PNA (red), DAPI (nuclei, blue). (D-F) Representative electron micrographs from 12-wk-old Atg5f/+;Cre+ and Atg5ΔCone (n = 2 per group). (D) Atg5f/+;Cre+, no starvation. (E) Atg5f/+;Cre+, starvation; with enlarged image of an autophagosome (AP). (F) Atg5ΔCone, starvation. OS, outer segment; IS, inner segment; m, mitochondria; CC, connecting cilium. (G-H) Representative confocal images of retina (n = 4−6 retina examined per group) from 12-wk-old mice stained for phospho (p-)AMPK. (G) Atg5f/+; Cre+. (H) Atg5ΔCone. (I) Light adapted b-wave responses for 12-wk-old Atg5f/+;Cre+ (n = 4) and Atg5ΔCone (n = 5) mice with and without starvation. (J) Dark-adapted b-wave responses for Atg5f/+;Cre+ (n = 4) and Atg5ΔCone (n = 3) mice with and without starvation (*p < 0.05).
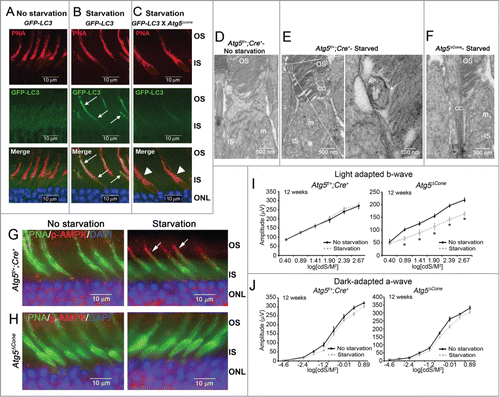
Figure 2. Light-induced damage to ATG5-deficient cone photoreceptors. (A) Twelve-wk-old Atg5f/+;Cre+ control (n = 4) and Atg5ΔCone mice (n = 5) were exposed to 13,000 lx for 7 h and returned to normal lighting for 1 wk. Cone counts performed on retinal flat mounts. Data represent the mean ± standard error. * denotes significantly different from control (p < 0.05); ns, not significant. (B) and (C) Representative confocal images of Atg5f/+;Cre+ (B) and Atg5ΔCone (C) retinae before and after light stress stained for PNA (green), OPN1MW/M-opsin (red), OPN1SW/S-opsin (blue), and DAPI (orange). (D) and (E) Representative confocal images of Atg5f/+;Cre+ (D) and Atg5ΔCone (E) retinae before and after light stress stained for PNA (green), TOMM20 (red), and DAPI (blue). (F) and (G). Representative images of Atg5f/+;Cre+ (F) and Atg5ΔCone (G) retinae before and after light stress stained with toluidine blue. RPE, retinal pigmented epithelium; OS, outer segment; IS, inner segment; ONL, outer nuclear layer; INL, inner nuclear layer. (n = 4−6 retina examined per group)
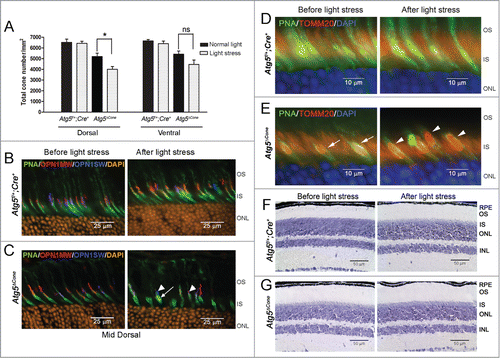
Figure 3. Analysis of the inner segments of ATG5-deficient cones. (A) Representative confocal images of retina (n = 6 retina examined per group) from 24-wk-old Atg5f/+;Cre+ and Atg5ΔCone mice stained for SQSTM1 (red, arrows); PNA (green), OPN1MW/M-opsin (blue) and nuclei (orange). OS, outer segment; IS, inner segment; ONL, outer nuclear layer. (B-E), TEM analysis of cone inner segment morphology in the retinae of control (Atg5f/+;Cre+) (B, C) and Atg5ΔCone (D, E) mice at 29 wk of age. Calibration Bars: (B, D) = 2 µm; (C, E) = 0.5 µm. Dashed line indicates outline of CIS. CIS, cone inner segment; COS, cone outer segment. (F) Quantitative analysis of cone inner segment length from TEM micrographs taken at 12 wk and 29 wk. (G) Cone inner segment area from TEM micrographs taken at 12 wk and 29 wk. (H) Mitochondrial area from TEM micrographs taken at 12 wk and 29 wk. * denotes significantly different from control (p<0.05), n = 4. (I) Representative confocal images of live retinal explants from Atg5f/+; Cre+ and Atg5ΔCone mice staining for ROS, arrows; PNA (red) and DHR123 (ROS, green).
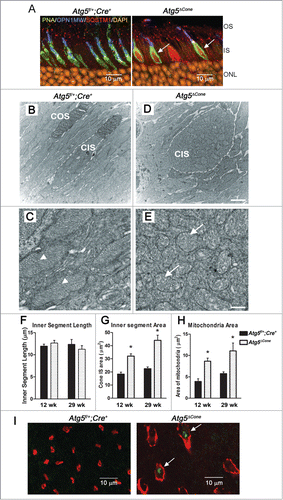
Figure 4. Degeneration of ATG5-deficient cones. (A) Mouse retinae from Atg5f/+;Cre+ (n = 4 for each time point) and Atg5ΔCone mice (n = 4 for each time point) were harvested at various ages and cones were enumerated following staining of retinal flat mounts for PNA (green), OPN1MW/M-opsin (red) and OPN1SW/S-opsin (blue). Data represent the mean ± standard error, * denotes statistically different (p < 0.05) from control which is represented by the dotted line (cone numbers averaged from all control mice = 5884 ± 48). (B) Representative confocal micrographs of the dorsal region of the retina from Atg5f/+;Cre+ (left panels) and Atg5ΔCone mice (right panels) taken at 18 wk (upper panels) and 40 wk (lower panels) (n = 4−6 retina examined per group). (C) Representative confocal micrographs of the ventral region of the retina from Atg5f/+;Cre+ (left panels) and Atg5ΔCone mice (right panels) taken at 18 wk (upper panels) and 40 wk (lower panels) (n = 4−6 retina examined per group). Representative confocal images of the retinae of control Atg5f/+; Cre+ (D) and Atg5ΔCone (E) mice at 7, 29, and 51 wk illustrating the loss of both M (red) and S (blue) cones in Atg5ΔCone mice. PNA (green) and nuclei (orange), n = 4−6 retina examined per group. (F) M-cone outer segment length of Atg5f/+; Cre+ and Atg5ΔCone mice at 7, 29, and 51 wk. Data represent the mean ± standard error, * denotes statistically significant from control (p < 0.05), n = 4 for each time point.
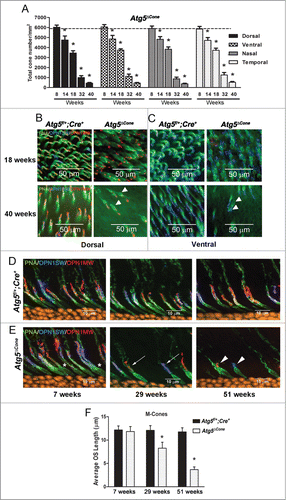
Figure 5. Response to light stimuli in ATG5-deficient cones. (A-C) Ex vivo ERG responses. Cone a-wave responses in 12-wk-old Atg5f/+; Cre+ control (A) and Atg5ΔCone mice (B). (C) Logarithmic normalized a-wave response amplitudes (R/Rmax)) from ex vivo ERG experiments plotted as a function of E for control and Atg5ΔCone mice (mean ± SEM, n = 16 control and 16 Atg5ΔCone retinas, **denotes significantly different from control, p = 0.003). Equation 1 with E1/2 of 5,400 and 6,900 photons μm−2 described the amplitude data of control and Atg5ΔCone mice (least squares fitting), respectively. (D-F) Logarithmic normalized cone b-wave amplitudes from in vivo ERG recordings plotted as a function of flash energy for 8- (D) and 18- (E) wk-old control and Atg5ΔCone mice. (F) The maximal amplitudes at 8, 12, 18, and 32 wk for control (Atg5f/+;Cre+) and Atg5ΔCone mice are shown. ** denotes significantly different from control, p < 0.05 (n = 5).
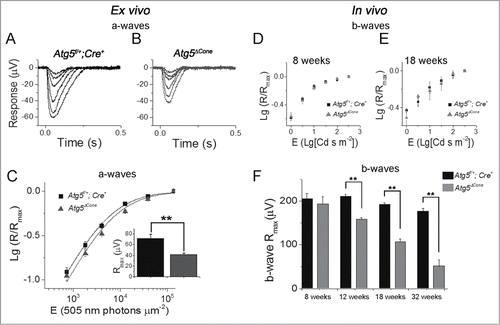
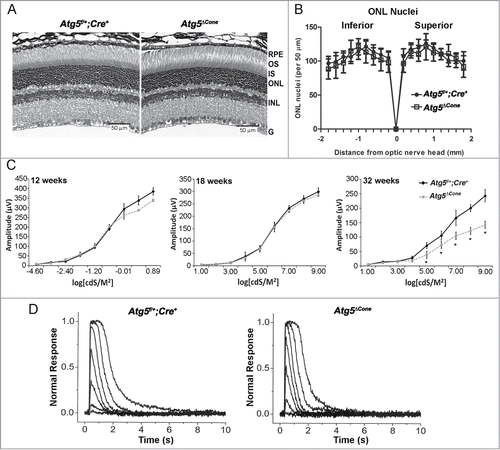
Figure 6. Analysis of rod function in Atg5ΔCone mice. (A) Retinal sections from Atg5f/+; Cre+ (left) and Atg5ΔCone (right) mice at 52 wk. (B) Outer nuclear layer nuclei density in Atg5f/+; Cre+ and Atg5ΔCone mice at 54 wk. (C) Comparison of rod in vivo ERG a-wave response amplitudes from Atg5f/+; Cre+ control) and Atg5ΔCone mice at 8 wk (left), 18 wk (middle), and 32 wk (right). * denotes significantly different from control, p < 0.05, n = 5. (D) Representative flash response families from Atg5f/+; Cre+ control (left) and Atg5ΔCone (right) mice at 52 wk. Flash intensities range from 0.9 to 1297 photons µm−2 in ~0.5 log unit increments.