Figures & data
Figure 1. AIEC infection induces activation of the EIF2AK4-EIF2A-ATF4 pathway in T84 cells. T84 cells were infected with AIEC LF82 strain or the E. coli K12 MG1655 and the commensal E. coli HS strain. In parallel, cells were treated with KRB for 1 h. (A, B) Western blot analysis for the activation of the EIF2AK4-EIF2A-ATF4 pathway. (C) qRT-PCR analysis for mRNA expression levels of known ATF4 target genes, including TRIB3, ATF3, DDIT3 and ASNS. Data are means ± SEM of 6 replicates and are representative of 3 independent experiments. *, P < 0.05; **, P ≤ 0.005.
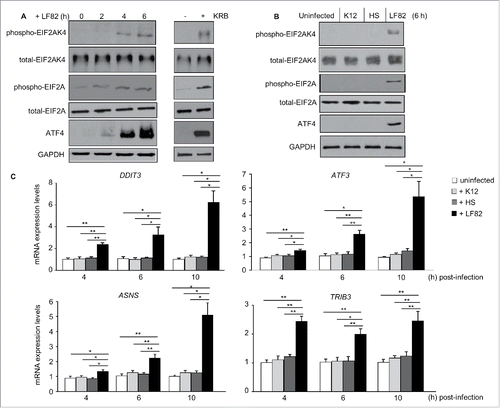
Figure 2. Eif2ak4 depletion results in increased AIEC intracellular replication and enhanced AIEC-induced production of cytokines and chemokines. Wild-type (WT) MEFs and MEFs depleted for Eif2ak4 (eif2ak4−/−) were infected with AIEC LF82 for 6 h (B), 12 h (D), 24 h (E) or the indicated time (A, C). In parallel, MEFs were treated with KRB for 4 h. (A) Western blot analysis for the activation of the EIF2AK4-EIF2A-ATF4 pathway. (B) qRT-PCR analysis for mRNA expression levels of ATF4 target genes, including Trib3, Atf3, Ddit3 and Asns. (C) Intracellular LF82 number counted on LB agar plates. (D) Representative confocal micrographs of cells infected with LF82-GFP. Actin cytoskeleton was stained with Rhodamine-phalloidin (red). Nuclei were stained with Hoechst (blue). Bars: 5 μm. (E) Secreted IL6 and CXCL1 amounts in cell culture supernatant quantified by ELISA. Data are means ± SEM of 6 replicates and are representative of 3 independent experiments. *, P < 0.05; **, P ≤ 0.005; ***, P ≤ 0.001.
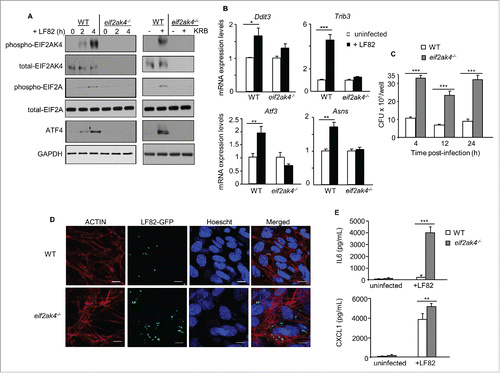
Figure 3. Eif2ak4 depletion blocks autophagy activation in response to AIEC infection by inhibiting the ATF4-mediated transcription of autophagy genes. Wild-type (WT) MEFs and MEFs depleted for Eif2ak4 (eif2ak4−/−) were infected with AIEC LF82 or treated with 40 μg/ml rapamycin for 6 h. (A) Representative western blot analysis for LC3 and SQSTM1 levels. Quantification of band intensity of LC3-II relative to GAPDH from 3 independent blots is shown in the bottom panel. Values represent means ± SEM **, P ≤ 0.005. (B) Representative confocal micrographs of cells infected with LF82-GFP (green) and immunolabeled for LC3 (red). Nuclei were stained with Hoechst (blue). Bars: 5 μm. The graph to the right shows the percentage of LF82-GFP in LC3-positive vacuoles determined from 3 independent experiments, counting 20 cells/experiment. Values represent means ± SEM ***, P ≤ 0.001. (C) Representative confocal micrographs of WT, eif2ak4−/− and atg5−/− MEFs pre-transfected with the pEGFP-LC3 plasmid and infected with LF82 or treated with rapamycin. Bars: 5 μm. The graph to the right shows the number of GFP-LC3 puncta per cell determined from 3 independent experiments, counting 10 cells/experiment. Values represent means ± SEM ***, P ≤ 0.001. (D) qRT-PCR analysis for mRNA expression levels of the autophagy genes Map1lc3b, Atg7, Atg3, Becn1 and Sqstm1. Data are means ± SEM of 6 replicates and are representative of 3 independent experiments. *, P < 0.05. (E, F) ChIP analysis for the binding of ATF4 to the autophagy gene promoters. The protein-DNA complexes were immunoprecipitated with anti-ATF4 or a negative control IgG. (E) Representative agarose gels for the ATF4-binding regions in the autophagy gene promoters or Gapdh DNA in the input amplified by semiquantitative PCR. (F) Increase in the binding of ATF4 to the autophagy gene promoters, normalized to Gapdh DNA in the input, upon LF82 infection analyzed by qPCR. Data are means ± SEM of 4 replicates and are representative of 2 independent experiments. *, P < 0.05.
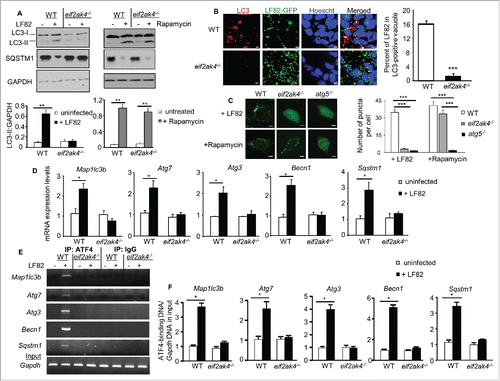
Figure 4. SiRNA-mediated depletion of EIF2AK4 in T84 cells inhibits autophagy activation in response to AIEC infection, increasing AIEC intracellular replication and AIEC-induced inflammation. T84 cells were transfected with control or EIF2AK4-specific siRNA for 36 h and then infected or not with the AIEC LF82 strain for 6 h or incubated with KRB for 1 h (A) or treated with 40 μg/ml rapamycin for 6 h (B). (A) Western blot analysis for the activation of the EIF2AK4-EIF2A-ATF4 pathway. (B) Representative western blot analysis for LC3 and SQSTM1 levels. Quantification of band intensity of LC3-II relative to GAPDH from 3 independent blots was shown in the bottom panel. Values are means ± SEM *, P < 0.05; **, P ≤ 0.005. (C) qRT-PCR analysis for mRNA expression levels of the autophagy genes MAP1LC3B, ATG3, ATG7, BECN1 and SQSTM1. (D) Cells were infected with AIEC LF82 in the presence or absence of 40 μg/ml rapamycin. Intracellular LF82 number was counted on LB agar plates. (E) Secreted IL8 amounts in cell culture supernatant quantified by ELISA. Data are means ± SEM of 6 replicates and are representative of 3 independent experiments. *, P < 0.05; **, P ≤ 0.005; ***, P ≤ 0.001 (C-E).
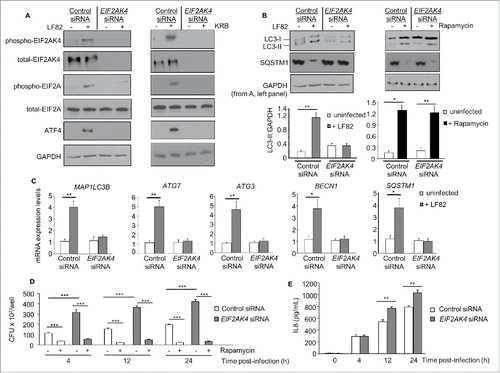
Figure 5. Activation of the EIF2AK4-EIF2A-ATF4 pathway in IECs from AIEC-infected mice, inducing an autophagy response. Wild-type (WT) and eif2ak4−/− mice were infected with LF82 by gavage and ileal enterocytes were extracted as described in Materials and methods. (A) Representative immunoblots for the analysis of the EIF2AK4-EIF2A-ATF4 pathway. The graphs to the right represent quantification of immunoblots of phospho-EIF2AK4, phospho-EIF2A and ATF4 relative to GAPDH from n = 9 mice/group. (B) Representative western blot analysis for LC3 and SQSTM1 levels. Quantification of band intensity of LC3-II relative to GAPDH from n = 9 mice/group was shown in the bottom panel. (C) qRT-PCR analysis for mRNA expression levels of the autophagy genes Map1lc3b, Atg3, Atg7, Becn1 and Sqstm1. (D) ChIP analysis for the binding of ATF4 to the autophagy gene promoters. The protein-DNA complexes were immunoprecipitated with anti-ATF4 antibody or a negative control IgG. Representative agarose gels for the ATF4-binding regions in the autophagy gene promoters or Gapdh DNA in the input amplified by semiquantitative PCR are shown. Data are means ± SEM from n = 9 mice/group. **, P ≤ 0.005; ***, P ≤ 0.001.
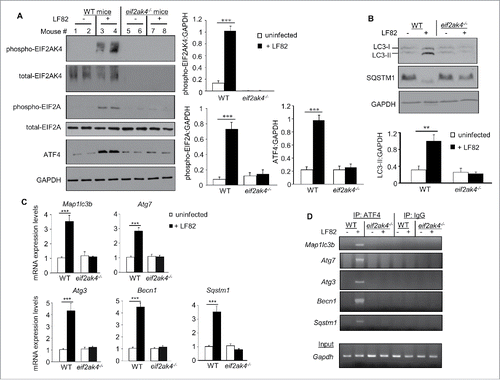
Figure 6. Eif2ak4 depletion increases AIEC intestinal colonization and AIEC-induced inflammation in mice. Wild type (WT) and eif2ak4−/− mice were infected with 109 CFU of LF82 bacteria or the E. coli K12 MG1655 strain by gavage for 3 d. Quantification of LF82 and K12 bacteria in the feces collected every day post-infection (A) or associated with the intestinal mucosa determined at day of sacrifice (B). The quantification for each mouse (symbols) and the median (bars) are shown (A, B). (C) Representative confocal micrographs of ileal sections immunolabeled for E. coli lipopolysaccharide O83 (green) from LF82-infected WT and eif2ak4−/− mice. Nuclei were stained with Hoechst (blue). Bars: 10 μm. (D) mRNA expression levels of Cxcl1 and Il6 in mouse ileal tissues were assessed by qRT-PCR. (E) Secreted CXCL1 and IL6 amount in ileal tissue culture supernatant were quantified by ELISA. Data are means ± SEM from n = 9 mice/group. *, P < 0.05; **, P ≤ 0.005; ***, P ≤ 0.001.
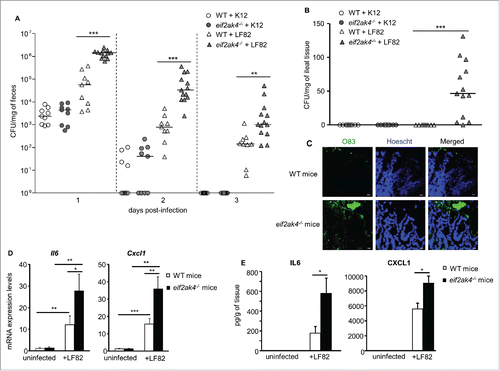
Figure 7. The EIF2AK4-EIF2A-ATF4 pathway is activated in noninflamed CD and deactivated in inflamed CD. Total proteins and RNA were extracted from the terminal ileal biopsy specimens from normal controls or patients with CD (with normal appearance [noninflamed CD] or with macroscopic inflammation [inflamed CD]). (A) Western blot analysis for the activation of the EIF2AK4-EIF2A-ATF4 pathway is shown in the left panel. Quantification of band intensity is shown in the right graphs. (B) qRT-PCR analysis for mRNA expression levels of the known ATF4 target genes (TRIB3, ATF3, DDIT3 and ASNS) and the autophagy genes shown to be regulated by ATF4 in this study (SQSTM1, MAP1LC3B, BECN1, ATG3 and ATG7). Data are represented as scatter dot plots; each dot shows one case number and the bars show the median. Data were analyzed by the nonparametric Mann-Whitney test. *, P < 0.05; **, P ≤ 0.005; ***, P ≤ 0.001.
![Figure 7. The EIF2AK4-EIF2A-ATF4 pathway is activated in noninflamed CD and deactivated in inflamed CD. Total proteins and RNA were extracted from the terminal ileal biopsy specimens from normal controls or patients with CD (with normal appearance [noninflamed CD] or with macroscopic inflammation [inflamed CD]). (A) Western blot analysis for the activation of the EIF2AK4-EIF2A-ATF4 pathway is shown in the left panel. Quantification of band intensity is shown in the right graphs. (B) qRT-PCR analysis for mRNA expression levels of the known ATF4 target genes (TRIB3, ATF3, DDIT3 and ASNS) and the autophagy genes shown to be regulated by ATF4 in this study (SQSTM1, MAP1LC3B, BECN1, ATG3 and ATG7). Data are represented as scatter dot plots; each dot shows one case number and the bars show the median. Data were analyzed by the nonparametric Mann-Whitney test. *, P < 0.05; **, P ≤ 0.005; ***, P ≤ 0.001.](/cms/asset/44d6e897-c927-43e5-900f-5e091af604e9/kaup_a_1156823_f0007_b.gif)
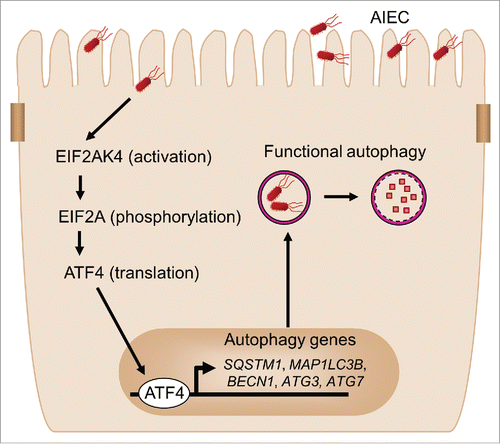
Figure 8. Proposed model for the involvement of the EIF2AK4-EIF2A-ATF4 pathway in autophagy response to AIEC infection in intestinal epithelial cells. Upon AIEC infection, the EIF2AK4-EIF2A-ATF4 signaling pathway is activated in host cells, inducing transcription of several autophagy genes including SQSTM1, MAP1LC3B, BECN1, ATG3 and ATG7 and thereby a functional autophagic response. This serves as a host defense mechanism to eliminate intracellular AIEC and to inhibit AIEC-induced intestinal inflammation.
