3,116
Views
55
CrossRef citations to date
0
Altmetric
Basic Research Papers

Upregulation of SQSTM1/p62 contributes to nickel-induced malignant transformation of human bronchial epithelial cells

, , , , , , , , , , , , & show all
Pages 1687-1703 | Received 05 Feb 2015, Accepted 26 May 2016, Published online: 19 Aug 2016

Figures & data

Figure 1. Upregulation of SQSTM1 expression by nickel in vitro and in vivo, as well as SQSTM1 overexpression in human lung cancer tissues. (A and B) 2×10⁵ of Beas-2B cells were seeded into each well of 6-well plates. After the cell density reached 80∼90%, the cells were exposed to 1.0 mM NiCl2 for the various time points indicated. The cells were then extracted with an SDS-sample buffer (10 mM Tris-HCl, pH 7.4, 1% SDS, 1mM Na3VO4, and 1× complete protease inhibitor) and cell extracts were subjected to protein gel blot. ACTB was used as a control for protein loading. The data shown in (A) are representative of 3 independent experiments, and the SQSTM1 expression band was quantitatively analyzed by using prism software and presented in (B). (C) Beas-2B GFP-SQSTM1 stable transfectants were identified with western blotting; primary antibodies against GFP or SQSTM1 were used to determine exogenous GFP-SQSTM1 expression. (D) Beas-2B(GFP-SQSTM1) cells (1×10⁴) were seeded into each well of an 8-well chamber. Following culturing at 37°C for 48 h, the cells were treated with 1.0 mM NiCl2 for the time points indicated, and the GFP-SQSTM1 distributions in Beas-2B cells were captured using fluorescence microscopy. (E-G) C57BL/6J mice were exposed to nickel nanoparticles via inhalation for 24 h or 48 h (E) or 5-months (F). Lung tissues were extracted for protein extracts and the extracts were subjected to western blot. ACTB was used as a protein loading control. (G) Seven pairs of human primary lung cancers and their adjacent normal lung tissues were obtained from the First Affiliated Hospital of Wenzhou Medical University; the tissue extracts were subjected to western blotting and TUBA was used as a protein loading control.
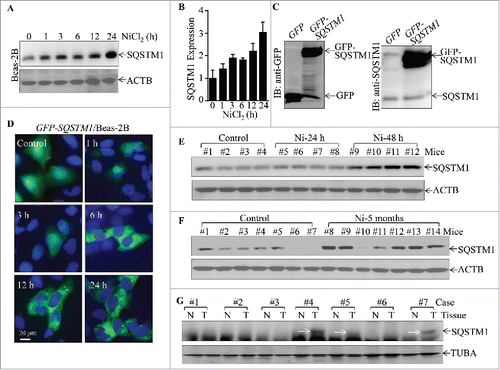
Figure 1. Upregulation of SQSTM1 expression by nickel in vitro and in vivo, as well as SQSTM1 overexpression in human lung cancer tissues. (A and B) 2×10⁵ of Beas-2B cells were seeded into each well of 6-well plates. After the cell density reached 80∼90%, the cells were exposed to 1.0 mM NiCl2 for the various time points indicated. The cells were then extracted with an SDS-sample buffer (10 mM Tris-HCl, pH 7.4, 1% SDS, 1mM Na3VO4, and 1× complete protease inhibitor) and cell extracts were subjected to protein gel blot. ACTB was used as a control for protein loading. The data shown in (A) are representative of 3 independent experiments, and the SQSTM1 expression band was quantitatively analyzed by using prism software and presented in (B). (C) Beas-2B GFP-SQSTM1 stable transfectants were identified with western blotting; primary antibodies against GFP or SQSTM1 were used to determine exogenous GFP-SQSTM1 expression. (D) Beas-2B(GFP-SQSTM1) cells (1×10⁴) were seeded into each well of an 8-well chamber. Following culturing at 37°C for 48 h, the cells were treated with 1.0 mM NiCl2 for the time points indicated, and the GFP-SQSTM1 distributions in Beas-2B cells were captured using fluorescence microscopy. (E-G) C57BL/6J mice were exposed to nickel nanoparticles via inhalation for 24 h or 48 h (E) or 5-months (F). Lung tissues were extracted for protein extracts and the extracts were subjected to western blot. ACTB was used as a protein loading control. (G) Seven pairs of human primary lung cancers and their adjacent normal lung tissues were obtained from the First Affiliated Hospital of Wenzhou Medical University; the tissue extracts were subjected to western blotting and TUBA was used as a protein loading control.

Figure 2. SQSTM1 upregulation played an important role in nickel-induced malignant transformation of human bronchial epithelial cells. (A and F) shSQSTM1-#1, shSQSTM1-#2, and shSQSTM1-#3 represent different shRNAs that specifically target 3 different sequences in SQSTM1 mRNA and its nonsense vector were stably transfected into Beas-2B cells (A) or BEP2D cells (F), respectively, and their stable transfectants were established and identified by western blot with specific anti-SQSTM1 antibody. (B and C) Beas-2B(Nonsense), Beas-2B(shSQSTM1-#1) and Beas-2B(shSQSTM1-#3) cells were repeatedly exposed to 0.5 mM NiCl2 for 6 months and then subjected to soft agar assay. The cell colonies were counted by microscopy. Each bar indicates the mean and SD from triplicate assays. The symbol (*) indicates a significant increase as compared with the medium control (p < 0.05), while the symbol (♣) indicates a significant decrease as compared with the Beas-2B (Nonsense) cells (p < 0.05). (D and E) Beas-2B(GFP) and Beas-2B(GFP-SQSTM1) cells were repeatedly exposed to 0.5 mM NiCl2 for 5 months and then subjected to the soft agar assay. Each bar indicates the mean and SD from triplicate assays. The symbol (*) indicates a significant increase in comparison to the Beas-2B(GFP) control (p < 0.05). (G and H) BEP2D(Nonsense), BEP2D(shSQSTM1-#1) and BEP2D(shSQSTM1-#3) cells were repeatedly exposed to 0.5 mM NiCl2 for 4 months and then subjected to the soft agar assay. The cell colonies were counted by microscopy. Each bar indicates the mean and SD from triplicate assays. The symbol (*) indicates a significant increase as compared with the medium control (p < 0.05), while the symbol (♣) indicates a significant inhibition as compared with the Beas-2B(Nonsense) cells (p < 0.05).
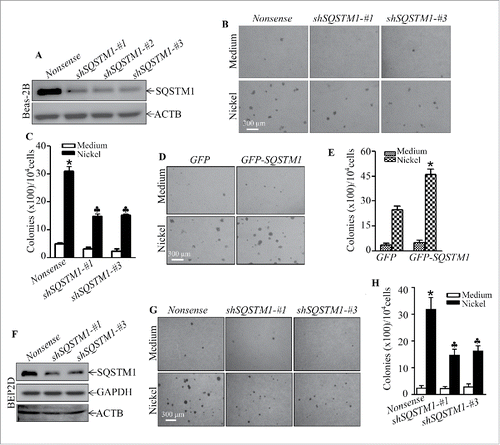
Figure 2. SQSTM1 upregulation played an important role in nickel-induced malignant transformation of human bronchial epithelial cells. (A and F) shSQSTM1-#1, shSQSTM1-#2, and shSQSTM1-#3 represent different shRNAs that specifically target 3 different sequences in SQSTM1 mRNA and its nonsense vector were stably transfected into Beas-2B cells (A) or BEP2D cells (F), respectively, and their stable transfectants were established and identified by western blot with specific anti-SQSTM1 antibody. (B and C) Beas-2B(Nonsense), Beas-2B(shSQSTM1-#1) and Beas-2B(shSQSTM1-#3) cells were repeatedly exposed to 0.5 mM NiCl2 for 6 months and then subjected to soft agar assay. The cell colonies were counted by microscopy. Each bar indicates the mean and SD from triplicate assays. The symbol (*) indicates a significant increase as compared with the medium control (p < 0.05), while the symbol (♣) indicates a significant decrease as compared with the Beas-2B (Nonsense) cells (p < 0.05). (D and E) Beas-2B(GFP) and Beas-2B(GFP-SQSTM1) cells were repeatedly exposed to 0.5 mM NiCl2 for 5 months and then subjected to the soft agar assay. Each bar indicates the mean and SD from triplicate assays. The symbol (*) indicates a significant increase in comparison to the Beas-2B(GFP) control (p < 0.05). (G and H) BEP2D(Nonsense), BEP2D(shSQSTM1-#1) and BEP2D(shSQSTM1-#3) cells were repeatedly exposed to 0.5 mM NiCl2 for 4 months and then subjected to the soft agar assay. The cell colonies were counted by microscopy. Each bar indicates the mean and SD from triplicate assays. The symbol (*) indicates a significant increase as compared with the medium control (p < 0.05), while the symbol (♣) indicates a significant inhibition as compared with the Beas-2B(Nonsense) cells (p < 0.05).

Figure 3. The induction of Beas-2B cell autophagy by nickel exposure. (A and B) 2 × 10⁵ Beas-2B cells were seeded into each well of 6-well plates. After the cell density reached 80∼90%, Beas-2B cells were treated with 1.0 mM NiCl2 for the indicated time (A) or with various concentrations of NiCl2 for 12 h (B). The cells were then extracted with SDS-sample buffer and cell extracts were subjected to western blot. (C) 1 × 10⁴ stable Beas-2B(GFP) and Beas-2B(GFP-LC3B) transfectants were seeded into each well of an 8-well chamber. After being cultured at 37°C for 48 h, the cells were exposed to 1.0 mM NiCl2 for the time indicated. The images were captured using fluorescence microscopy. The average GFP-LC3B puncta number were quantified and presented as puncta number/cell (D). The symbol (*) indicates a significant increase as compared with the medium control (p < 0.05). (E) 2×10⁵ Beas-2B(GFP-LC3B) transfectants were seeded into each well of 6-well plates and the cells were exposed to 1.0 mM NiCl2 for various time points, as indicated. The cell extracts were subjected to western blotting.
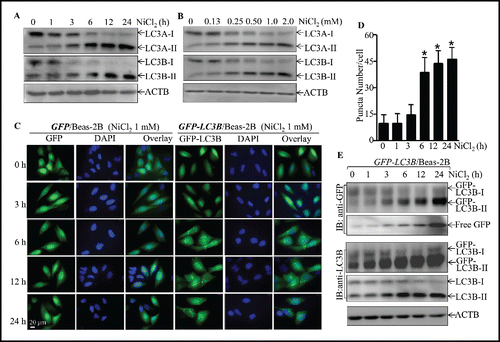
Figure 3. The induction of Beas-2B cell autophagy by nickel exposure. (A and B) 2 × 10⁵ Beas-2B cells were seeded into each well of 6-well plates. After the cell density reached 80∼90%, Beas-2B cells were treated with 1.0 mM NiCl2 for the indicated time (A) or with various concentrations of NiCl2 for 12 h (B). The cells were then extracted with SDS-sample buffer and cell extracts were subjected to western blot. (C) 1 × 10⁴ stable Beas-2B(GFP) and Beas-2B(GFP-LC3B) transfectants were seeded into each well of an 8-well chamber. After being cultured at 37°C for 48 h, the cells were exposed to 1.0 mM NiCl2 for the time indicated. The images were captured using fluorescence microscopy. The average GFP-LC3B puncta number were quantified and presented as puncta number/cell (D). The symbol (*) indicates a significant increase as compared with the medium control (p < 0.05). (E) 2×10⁵ Beas-2B(GFP-LC3B) transfectants were seeded into each well of 6-well plates and the cells were exposed to 1.0 mM NiCl2 for various time points, as indicated. The cell extracts were subjected to western blotting.

Figure 4. The effects of 3-MA and bafilomycin A1 on the nicekl-induced LC3-II formation. (A and B) 2 × 10⁵ Beas-2B cells were seeded into each well of 6-well plates and the cells were pretreated with 3-MA (5.0 mM) for 30 min and then exposed to 1.0 mM NiCl2 for 6 h. The cell extracts were subjected to western blotting. The symbol (*) indicates a significant increase as compared with the medium control (p < 0.05), while the symbol (♣) indicates a significant inhibition as compared with nickel-treated alone (p < 0.05). (C and D) 2 × 10⁵ Beas-2B cells were seeded into each well of 6-well plates and the cells were exposed to NiCl2 (1 mM) and bafilomycin A1 (Baf, 10 nM) for 6 h. The cell extracts were subjected to western blotting. The symbol (*) indicates a significant increase as compared with the medium control (p < 0.05), while the symbol (♣) indicates a significant increase as compared with the nickel-treated alone (p < 0.05).
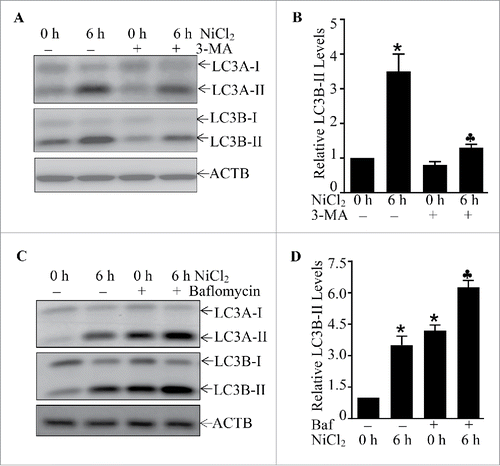
Figure 4. The effects of 3-MA and bafilomycin A1 on the nicekl-induced LC3-II formation. (A and B) 2 × 10⁵ Beas-2B cells were seeded into each well of 6-well plates and the cells were pretreated with 3-MA (5.0 mM) for 30 min and then exposed to 1.0 mM NiCl2 for 6 h. The cell extracts were subjected to western blotting. The symbol (*) indicates a significant increase as compared with the medium control (p < 0.05), while the symbol (♣) indicates a significant inhibition as compared with nickel-treated alone (p < 0.05). (C and D) 2 × 10⁵ Beas-2B cells were seeded into each well of 6-well plates and the cells were exposed to NiCl2 (1 mM) and bafilomycin A1 (Baf, 10 nM) for 6 h. The cell extracts were subjected to western blotting. The symbol (*) indicates a significant increase as compared with the medium control (p < 0.05), while the symbol (♣) indicates a significant increase as compared with the nickel-treated alone (p < 0.05).

Figure 5. The important role of MTOR, ULK1, and BECN1 in mediation of cell autophagy upon nickel exposure in Beas-2B cells. (A, B and D) 2 × 10⁵ Beas-2B cells were seeded into each well of 6-well plates. After the cell density reached 80∼90%, the cells were exposed to 1.0 mM NiCl2 for the times indicated. The cell extracts were subjected to western blotting. (C) 2 × 10⁵ Beas-2B(PI3K-DA) and Beas-2B(Vector) transfectants were seeded into each well of 6-well plates. The cells were exposed to 1.0 mM NiCl2 for 6 h. The cell extracts were subjected to western blotting. (E and G) 2 × 10⁵ Beas-2B transfectants, as indicated, were seeded into each well of 6-well plates and the cells were exposed to 1.0 mM NiCl2 for 6 h (E) or various concentrations of NiCl2 for 6 h (G).The cell extracts were subjected to western blot and TUBA was used as protein loading control. (F and H) 2 × 10⁵ indicated Beas-2B transfectants were seeded into each well of 6-well plates and the cells were exposed to 1.0 mM NiCl2 and 10 nM of bafilomycin A1 (Baf) for 6 h. The cell extracts were subjected to western blot and ACTB was used as protein loading control.
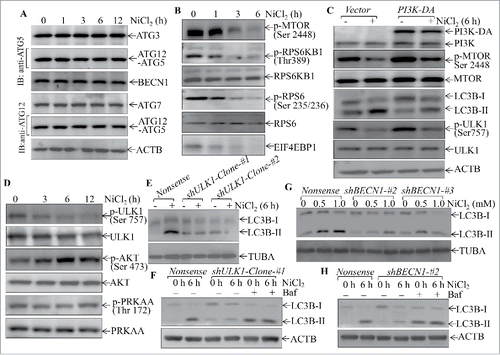
Figure 5. The important role of MTOR, ULK1, and BECN1 in mediation of cell autophagy upon nickel exposure in Beas-2B cells. (A, B and D) 2 × 10⁵ Beas-2B cells were seeded into each well of 6-well plates. After the cell density reached 80∼90%, the cells were exposed to 1.0 mM NiCl2 for the times indicated. The cell extracts were subjected to western blotting. (C) 2 × 10⁵ Beas-2B(PI3K-DA) and Beas-2B(Vector) transfectants were seeded into each well of 6-well plates. The cells were exposed to 1.0 mM NiCl2 for 6 h. The cell extracts were subjected to western blotting. (E and G) 2 × 10⁵ Beas-2B transfectants, as indicated, were seeded into each well of 6-well plates and the cells were exposed to 1.0 mM NiCl2 for 6 h (E) or various concentrations of NiCl2 for 6 h (G).The cell extracts were subjected to western blot and TUBA was used as protein loading control. (F and H) 2 × 10⁵ indicated Beas-2B transfectants were seeded into each well of 6-well plates and the cells were exposed to 1.0 mM NiCl2 and 10 nM of bafilomycin A1 (Baf) for 6 h. The cell extracts were subjected to western blot and ACTB was used as protein loading control.

Figure 6. Autophagy induced by nickel inhibited the SQSTM1 level in human Beas-2B cells. (A) 2 × 10⁵ Beas-2B cells were seeded into each well of 6-well plates. The cells were pretreated with 5.0 mM 3-MA for 30 min and then exposed to 0.5 mM or 1.0 mM NiCl2 for 24 h. (B-D) 2 × 10⁵ of Beas-2B stable transfectants, including Beas-2B(PI3K-DA), Beas-2B(shULK1), Beas-2B(shBECN1), and their corresponding control vector transfectants as indicated, were seeded into each well of 6-well plates. After the cell density reached 80∼90%, the cells were exposed to 1.0 mM NiCl2 for 24 h. The cells were extracted with SDS-sample buffer and western blot was carried out as described in the “Materials and Methods.” ACTB was used as a control for protein loading.
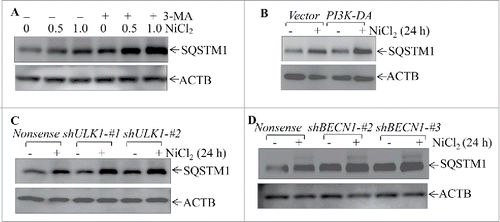
Figure 6. Autophagy induced by nickel inhibited the SQSTM1 level in human Beas-2B cells. (A) 2 × 10⁵ Beas-2B cells were seeded into each well of 6-well plates. The cells were pretreated with 5.0 mM 3-MA for 30 min and then exposed to 0.5 mM or 1.0 mM NiCl2 for 24 h. (B-D) 2 × 10⁵ of Beas-2B stable transfectants, including Beas-2B(PI3K-DA), Beas-2B(shULK1), Beas-2B(shBECN1), and their corresponding control vector transfectants as indicated, were seeded into each well of 6-well plates. After the cell density reached 80∼90%, the cells were exposed to 1.0 mM NiCl2 for 24 h. The cells were extracted with SDS-sample buffer and western blot was carried out as described in the “Materials and Methods.” ACTB was used as a control for protein loading.

Figure 7. Nickel induced SQSTM1 transcription in Beas-2B cells. (A) 2×10⁵ stable Beas-2B(GFP) and Beas-2B(GFP-SQSTM1) transfectants, as indicated, were seeded into each well of 6-well plates. The cells were exposed to 1.0 mM NiCl2 for the indicated time points. The cells were extracted with SDS-sample buffer and western blot was carried out. ACTB was used as protein loading control. (B) Beas-2B cells were treated with CHX (50 μg/ml) together with or without NiCl2 for the indicated times. The cell extracts were subjected to analysis of SQSTM1 protein degradation rate by western Blotting. (C, E and F) Beas-2B cells were exposed to 1.0 mM NiCl2 for different time points, as indicated (C), or treated with the indicated doses of NiCl2 for 12 h (E). The stable Beas-2B(GFP-SQSTM1) cells were exposed to 1.0 mM of NiCl2 for the indicated time periods (F). The cells collected from (C-F) were extracted with Trizol reagent for total RNA isolation and RT-PCR was performed to determine SQSTM1 or GFP-SQSTM1 expression with their specific primers. ACTB was used as an internal control. (D) Real-time PCR was carried out to determine the SQSTM1 mRNA expression using cDNA samples collected from Beas-2B cells exposed to 1.0 mM NiCl2 for 24 h obtained in (C). The symbol (*) indicates a significant increase as compared with the medium control (p < 0.05).
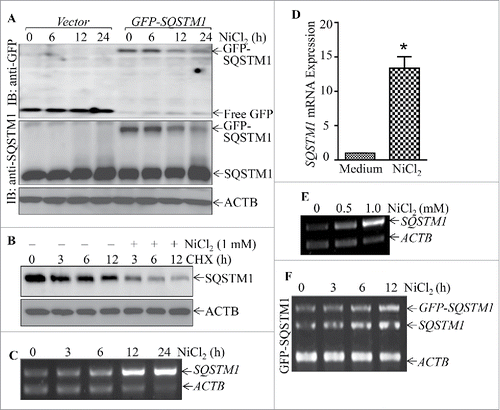
Figure 7. Nickel induced SQSTM1 transcription in Beas-2B cells. (A) 2×10⁵ stable Beas-2B(GFP) and Beas-2B(GFP-SQSTM1) transfectants, as indicated, were seeded into each well of 6-well plates. The cells were exposed to 1.0 mM NiCl2 for the indicated time points. The cells were extracted with SDS-sample buffer and western blot was carried out. ACTB was used as protein loading control. (B) Beas-2B cells were treated with CHX (50 μg/ml) together with or without NiCl2 for the indicated times. The cell extracts were subjected to analysis of SQSTM1 protein degradation rate by western Blotting. (C, E and F) Beas-2B cells were exposed to 1.0 mM NiCl2 for different time points, as indicated (C), or treated with the indicated doses of NiCl2 for 12 h (E). The stable Beas-2B(GFP-SQSTM1) cells were exposed to 1.0 mM of NiCl2 for the indicated time periods (F). The cells collected from (C-F) were extracted with Trizol reagent for total RNA isolation and RT-PCR was performed to determine SQSTM1 or GFP-SQSTM1 expression with their specific primers. ACTB was used as an internal control. (D) Real-time PCR was carried out to determine the SQSTM1 mRNA expression using cDNA samples collected from Beas-2B cells exposed to 1.0 mM NiCl2 for 24 h obtained in (C). The symbol (*) indicates a significant increase as compared with the medium control (p < 0.05).

Figure 8. RELA was a key transcription factor mediating SQSTM1 transcription following nickel exposure. (A) Potential transcription factor binding sites in the SQSTM1 promoter region (-1734∼+38) were analyzed using the TRANSFAC 8.3 engine online. (B) 2 × 10⁵ Beas-2B cells were seeded into each well of 6-well plates. The cells were exposed to 1.0 mM NiCl2 for the times indicated. The cell extracts were used to isolate cytoplasmic and nuclear fractions according to the protocol of the nuclear/cytosol fractionation kit. The isolated protein fractions were subjected to western blot. GAPDH and PARP were used as control for cytosol or nuclear protein loading, respectively. (C) Beas-2B(Vector) and Beas-2B(TAM67) cells were extracted with SDS-sample buffer and the cell extracts were analyzed by western blot with a specific anti-JUND antibody. (D) Stable Beas-2B(shRELA) and Beas-2B(Nonsense) cells were extracted with SDS-sample buffer and the cell extracts were analyzed by western blot with specific anti-RELA antibody. ACTB was used as a control for protein loading. (E and F) 2 × 10⁵ Beas-2B(TAM67) (E) or Beas-2B(shRELA) (F) cells and their corresponding vector transfectants were seeded into each well of 6-well plates. After the cell density reached 80∼90%, the cells were exposed to NiCl2 for 12 h and the cells were then extracted with Trizol reagent for total RNA isolation. SQSTM1 was amplified with specific primers by RT-PCR. ACTB was used as an internal control. (G) 1×10⁴ Besa-2B cells transfected with SQSTM1 full-length promoter-driven luciferase reporter (FL1) or NFKB-binding site-deleted SQSTM1 promoter-driven luciferase reporter (FL2) were seeded into each well of 96-well plates. After being cultured overnight, the cells were treated with 1.0 mM NiCl2 for 24 h. The luciferase activity was then determined and the results are presented as SQSTM1 promoter activity, relative to medium control. Each bar indicates the mean and SD of triplicate assay wells. The symbol (*) indicates a significant increase in comparison to the medium control (p < 0.05). The symbol (♣) indicates a dramatic decrease as compared to the Beas-2B cells transfected with FL1 (p < 0.05). (H) 1 × 10⁶ Beas-2B cells were seeded into 100-mm dishes. After the cell density reached 80∼90%, the cells were exposed to 1.0 mM NiCl2 for 12 h. A ChIP assay was performed with anti-RELA antibody to determine RELA binding to the SQSTM1 promoter as described in “Materials and Methods.”
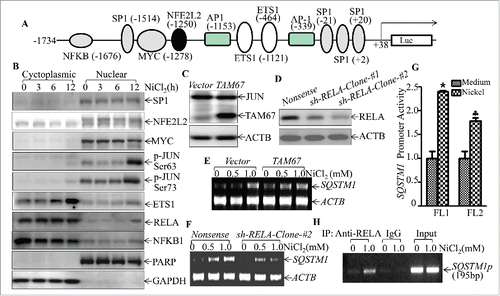
Figure 8. RELA was a key transcription factor mediating SQSTM1 transcription following nickel exposure. (A) Potential transcription factor binding sites in the SQSTM1 promoter region (-1734∼+38) were analyzed using the TRANSFAC 8.3 engine online. (B) 2 × 10⁵ Beas-2B cells were seeded into each well of 6-well plates. The cells were exposed to 1.0 mM NiCl2 for the times indicated. The cell extracts were used to isolate cytoplasmic and nuclear fractions according to the protocol of the nuclear/cytosol fractionation kit. The isolated protein fractions were subjected to western blot. GAPDH and PARP were used as control for cytosol or nuclear protein loading, respectively. (C) Beas-2B(Vector) and Beas-2B(TAM67) cells were extracted with SDS-sample buffer and the cell extracts were analyzed by western blot with a specific anti-JUND antibody. (D) Stable Beas-2B(shRELA) and Beas-2B(Nonsense) cells were extracted with SDS-sample buffer and the cell extracts were analyzed by western blot with specific anti-RELA antibody. ACTB was used as a control for protein loading. (E and F) 2 × 10⁵ Beas-2B(TAM67) (E) or Beas-2B(shRELA) (F) cells and their corresponding vector transfectants were seeded into each well of 6-well plates. After the cell density reached 80∼90%, the cells were exposed to NiCl2 for 12 h and the cells were then extracted with Trizol reagent for total RNA isolation. SQSTM1 was amplified with specific primers by RT-PCR. ACTB was used as an internal control. (G) 1×10⁴ Besa-2B cells transfected with SQSTM1 full-length promoter-driven luciferase reporter (FL1) or NFKB-binding site-deleted SQSTM1 promoter-driven luciferase reporter (FL2) were seeded into each well of 96-well plates. After being cultured overnight, the cells were treated with 1.0 mM NiCl2 for 24 h. The luciferase activity was then determined and the results are presented as SQSTM1 promoter activity, relative to medium control. Each bar indicates the mean and SD of triplicate assay wells. The symbol (*) indicates a significant increase in comparison to the medium control (p < 0.05). The symbol (♣) indicates a dramatic decrease as compared to the Beas-2B cells transfected with FL1 (p < 0.05). (H) 1 × 10⁶ Beas-2B cells were seeded into 100-mm dishes. After the cell density reached 80∼90%, the cells were exposed to 1.0 mM NiCl2 for 12 h. A ChIP assay was performed with anti-RELA antibody to determine RELA binding to the SQSTM1 promoter as described in “Materials and Methods.”

Figure 9. SQSTM1 upregulation contributed to inflammatory TNF induction by nickel. (A-C and J) 2 × 10⁵ Beas-2B transfectants, as indicated, were seeded into each well of 6-well plates. After the cell density reached 80∼90%, the cells were exposed to 1.0 mM NiCl2 for 24 h. Cells were extracted with Trizol reagent for total RNA isolation. Real-time PCR was carried out to monitor the TNF mRNA. (D and E) GFP-SQSTM1 or its control vector was transfected into Beas-2B(shRELA) cells. Cell extracts were subjected to western Blot for determination of protein expression as indicated (D). 2×10⁵ transfectants were seeded into each well of 6-well plates. The cells were then exposed to 1.0 mM NiCl2 for 24 h, and nickel-induced TNF mRNA was evaluated by real-time PCR (E). (F) 8 × 10³ Beas-2B (Nonsense/TNF-Luc) cells and Beas-2B (shSQSTM1-#1/TNF-Luc) cells were seeded into each well of a 96-well plate. After being cultured at 37°C overnight, the cells were exposed to 1.0 mM nickel for 24 h. The luciferase activity was measured. (G and H) TNF mRNA degradation rate in Beas-2B cell transfectants was determined following nickel treatment in the presence of actinomycin D (RNA synthesis inhibitor, 10 μM) for the indicated time. (I) Beas-2B cells were pretreated with 5.0 mM 3-MA for 30 min and then exposed to 1.0 mM NiCl2 for 24 h. The cells were extracted with Trizol reagent for total RNA isolation and then subjected to real-time PCR. The symbol (*) indicates a significant increase (p < 0.05), while the symbol (♣) indicates a significant decrease (p < 0.05).
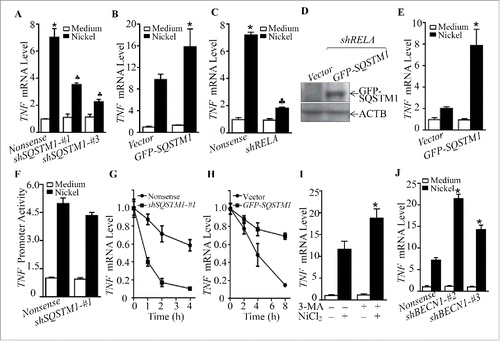
Figure 9. SQSTM1 upregulation contributed to inflammatory TNF induction by nickel. (A-C and J) 2 × 10⁵ Beas-2B transfectants, as indicated, were seeded into each well of 6-well plates. After the cell density reached 80∼90%, the cells were exposed to 1.0 mM NiCl2 for 24 h. Cells were extracted with Trizol reagent for total RNA isolation. Real-time PCR was carried out to monitor the TNF mRNA. (D and E) GFP-SQSTM1 or its control vector was transfected into Beas-2B(shRELA) cells. Cell extracts were subjected to western Blot for determination of protein expression as indicated (D). 2×10⁵ transfectants were seeded into each well of 6-well plates. The cells were then exposed to 1.0 mM NiCl2 for 24 h, and nickel-induced TNF mRNA was evaluated by real-time PCR (E). (F) 8 × 10³ Beas-2B (Nonsense/TNF-Luc) cells and Beas-2B (shSQSTM1-#1/TNF-Luc) cells were seeded into each well of a 96-well plate. After being cultured at 37°C overnight, the cells were exposed to 1.0 mM nickel for 24 h. The luciferase activity was measured. (G and H) TNF mRNA degradation rate in Beas-2B cell transfectants was determined following nickel treatment in the presence of actinomycin D (RNA synthesis inhibitor, 10 μM) for the indicated time. (I) Beas-2B cells were pretreated with 5.0 mM 3-MA for 30 min and then exposed to 1.0 mM NiCl2 for 24 h. The cells were extracted with Trizol reagent for total RNA isolation and then subjected to real-time PCR. The symbol (*) indicates a significant increase (p < 0.05), while the symbol (♣) indicates a significant decrease (p < 0.05).
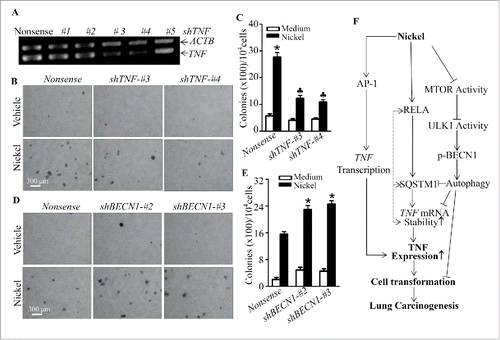
Figure 10. TNF induction mediated cell transformation of Beas-2B cells due to nickel exposure. (A) Specific TNF shRNAs were stably transfected into Beas-2B cells. The cells were extracted with Trizol reagent for total RNA isolation. TNF was amplified with its specific primers by RT-PCR. ACTB was used as an internal control. (B and C) Beas-2B(Nonsense), Beas-2B(shTNF-#3), and Beas-2B(shTNF-#4) cells were repeatedly treated with 0.5 mM NiCl2 for 6 months, then 1×10⁴ cells were subjected to a soft agar assay as described in “Materials and Methods.” The cell colonies were counted by microscopy. Each bar indicates the mean and SD from triplicate assays. The symbol (*) indicates a significant increase as compared to that of the medium control (p < 0.05), while the symbol (♣) indicates a dramatic decrease compared with Beas-2B(Nonsense) (p < 0.05). (D and E) Beas-2B(Nonsense), Beas-2B(shBECN1-#2), and Beas-2B(shBECN1-#3) cells were repeatedly treated with 0.5 mM NiCl2 for 4 months. 1 × 10⁴ treated cells were subjected to a soft agar assay. The symbol (*) indicates a significant increase in comparison to Beas-2B(Nonsense) (p < 0.05). (F) A novel molecular mechanisms underlying SQSTM1 induction and its role in malignant transformation of human bronchial epithelial cells following nickel exposure. The symbol (*) indicates a significant increase (p < 0.05), while the symbol (♣) indicates a significant decrease (p < 0.05).

Figure 10. TNF induction mediated cell transformation of Beas-2B cells due to nickel exposure. (A) Specific TNF shRNAs were stably transfected into Beas-2B cells. The cells were extracted with Trizol reagent for total RNA isolation. TNF was amplified with its specific primers by RT-PCR. ACTB was used as an internal control. (B and C) Beas-2B(Nonsense), Beas-2B(shTNF-#3), and Beas-2B(shTNF-#4) cells were repeatedly treated with 0.5 mM NiCl2 for 6 months, then 1×10⁴ cells were subjected to a soft agar assay as described in “Materials and Methods.” The cell colonies were counted by microscopy. Each bar indicates the mean and SD from triplicate assays. The symbol (*) indicates a significant increase as compared to that of the medium control (p < 0.05), while the symbol (♣) indicates a dramatic decrease compared with Beas-2B(Nonsense) (p < 0.05). (D and E) Beas-2B(Nonsense), Beas-2B(shBECN1-#2), and Beas-2B(shBECN1-#3) cells were repeatedly treated with 0.5 mM NiCl2 for 4 months. 1 × 10⁴ treated cells were subjected to a soft agar assay. The symbol (*) indicates a significant increase in comparison to Beas-2B(Nonsense) (p < 0.05). (F) A novel molecular mechanisms underlying SQSTM1 induction and its role in malignant transformation of human bronchial epithelial cells following nickel exposure. The symbol (*) indicates a significant increase (p < 0.05), while the symbol (♣) indicates a significant decrease (p < 0.05).
Supplemental material

Supplementary files

Download MS Word (2.2 MB)