2,500
Views
28
CrossRef citations to date
0
Altmetric
Basic Research Papers

Autophagy in Saccharomyces cerevisiae requires the monomeric GTP-binding proteins, Arl1 and Ypt6

&
Pages 1721-1737 | Received 28 Sep 2015, Accepted 24 May 2016, Published online: 27 Jul 2016

Figures & data

Figure 1. Arl1 and Ypt6 are involved in autophagy at the restrictive temperature of 37°C. (A) arl1Δ and ypt6Δ strains are sensitive to rapamycin at 37°C. All strains were streaked on YPD + DMSO (4.57 nM) or YPD + 5 ng/ml rapamycin in DMSO and cultured either at 30°C or 37°C. Plates were photographed after 3 d of growth. (B) GFP-Atg8 degradation was decreased in the arl1Δ strain at 37°C. WT (BY4743), atg1Δ, and arl1Δ strains were cultured at 30°C in nonstarvation medium until log-phase; then all the strains were incubated at 37°C or 30°C for 30 min. The cells were then washed twice with SD-N medium, and cultured in SD-N for 3 h either at 37°C or at 30°C. An aliquot of cells at 37°C were transferred back to 30°C and cultured in SD-N for an additional 3 h (denoted “R”). Whole cell lysates were subjected to immunoblot with anti-GFP antibody. (C) GFP-Atg8 degradation was decreased in the ypt6Δ strain at 37°C. The procedure was the same as . (D) The arl1Δ (YSA003) and ypt6Δ (YSA004) strains show decreased Pho8Δ60 activity at 37°C. Error bars represent standard deviation from 3 biological replicates. The samples were done in 3 technical replicates for each biological replicate.
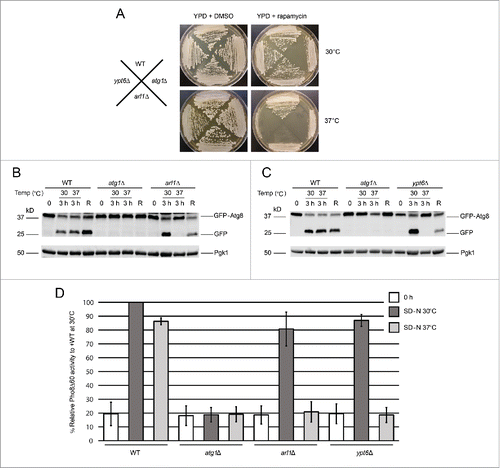
Figure 1. Arl1 and Ypt6 are involved in autophagy at the restrictive temperature of 37°C. (A) arl1Δ and ypt6Δ strains are sensitive to rapamycin at 37°C. All strains were streaked on YPD + DMSO (4.57 nM) or YPD + 5 ng/ml rapamycin in DMSO and cultured either at 30°C or 37°C. Plates were photographed after 3 d of growth. (B) GFP-Atg8 degradation was decreased in the arl1Δ strain at 37°C. WT (BY4743), atg1Δ, and arl1Δ strains were cultured at 30°C in nonstarvation medium until log-phase; then all the strains were incubated at 37°C or 30°C for 30 min. The cells were then washed twice with SD-N medium, and cultured in SD-N for 3 h either at 37°C or at 30°C. An aliquot of cells at 37°C were transferred back to 30°C and cultured in SD-N for an additional 3 h (denoted “R”). Whole cell lysates were subjected to immunoblot with anti-GFP antibody. (C) GFP-Atg8 degradation was decreased in the ypt6Δ strain at 37°C. The procedure was the same as Fig. 1B. (D) The arl1Δ (YSA003) and ypt6Δ (YSA004) strains show decreased Pho8Δ60 activity at 37°C. Error bars represent standard deviation from 3 biological replicates. The samples were done in 3 technical replicates for each biological replicate.

Figure 2. GTP-bound Arl1 or Ypt6 are able to suppress the autophagy defect of the arl1Δ or ypt6Δ strains at 37°C. (A) GFP-Atg8 degradation was recovered when the GTP-restricted form of Arl1 was expressed in the arl1Δ strain. WT Arl1, empty vector (YEp352), N-terminal myristoylation defective Arl1 (G2A), GTP-bound Arl1 (Q72L), GDP-bound Arl1 (N127I), or nucleotide-free Arl1 (D130N) were transformed into the arl1Δ strain. The GFP-Atg8 processing assay was performed. (B) Pho8Δ60 activity was recovered when the GTP-restricted form of Arl1 was expressed in the arl1Δ (YSA003) strain. Error bars represent standard deviation from 3 biological replicates. The samples were done in 3 technical replicates for each biological replicate. (C) GFP-Atg8 degradation was recovered when the GTP-bound form of Ypt6 was expressed. Empty vector (pRS316), WT, GTP-bound Ypt6 (Q69L) or GDP-bound Ypt6 (T24N) were transformed into the ypt6Δ strain. The GFP-Atg8 processing assay was performed. (D) Pho8Δ60 activity was recovered when the GTP-bound form of Ypt6 was expressed in the ypt6Δ strain (YSA004). Error bars represent standard deviation from 3 biological replicates. The samples were done in 3 technical replicates for each biological replicate. EV, empty vector.
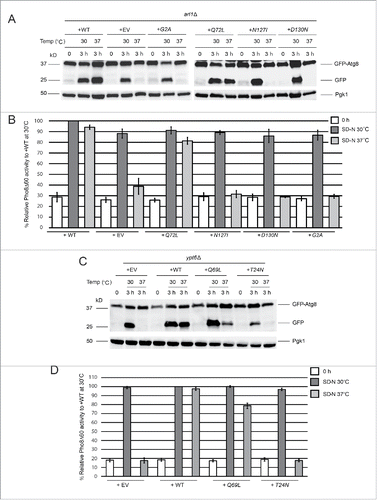
Figure 2. GTP-bound Arl1 or Ypt6 are able to suppress the autophagy defect of the arl1Δ or ypt6Δ strains at 37°C. (A) GFP-Atg8 degradation was recovered when the GTP-restricted form of Arl1 was expressed in the arl1Δ strain. WT Arl1, empty vector (YEp352), N-terminal myristoylation defective Arl1 (G2A), GTP-bound Arl1 (Q72L), GDP-bound Arl1 (N127I), or nucleotide-free Arl1 (D130N) were transformed into the arl1Δ strain. The GFP-Atg8 processing assay was performed. (B) Pho8Δ60 activity was recovered when the GTP-restricted form of Arl1 was expressed in the arl1Δ (YSA003) strain. Error bars represent standard deviation from 3 biological replicates. The samples were done in 3 technical replicates for each biological replicate. (C) GFP-Atg8 degradation was recovered when the GTP-bound form of Ypt6 was expressed. Empty vector (pRS316), WT, GTP-bound Ypt6 (Q69L) or GDP-bound Ypt6 (T24N) were transformed into the ypt6Δ strain. The GFP-Atg8 processing assay was performed. (D) Pho8Δ60 activity was recovered when the GTP-bound form of Ypt6 was expressed in the ypt6Δ strain (YSA004). Error bars represent standard deviation from 3 biological replicates. The samples were done in 3 technical replicates for each biological replicate. EV, empty vector.

Figure 3. Arl1 and Ypt6 are required for Atg8 transport to the vacuole at 37°C. Atg8 is mislocalized in arl1Δ and ypt6Δ strains at 37°C. Cells were grown, then starved for nitrogen as described. FM 4–64 was used to stain the vacuolar membrane. Experiments were repeated 3 times and the results shown are from a single experiment. (A) Fluorescence images for WT, atg1Δ, arl1Δ and ypt6Δ in nonstarvation conditions. (B) Fluorescence images for WT, atg1Δ, arl1Δ and ypt6Δ in starvation conditions at 30°C. (C) Fluorescence images for WT, atg1Δ, arl1Δ and ypt6Δ in starvation conditions at 37°C. (D) The percentage of cells with Atg8 dots in 3 categories: 0, ≤ 2 and multiple dots (> 2 dots per cell) was quantified. At least 150 cells were counted for each strain. Error bars represent standard deviation from 3 biological replicates. Scale bar: 3 µm.
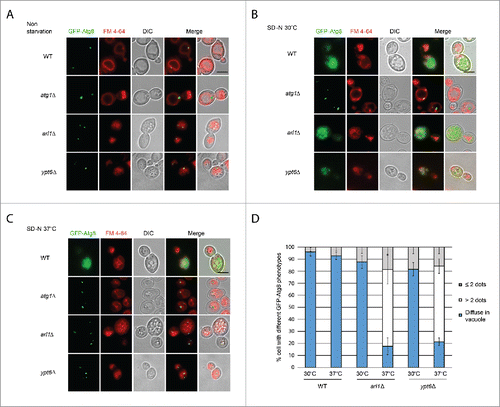
Figure 3. Arl1 and Ypt6 are required for Atg8 transport to the vacuole at 37°C. Atg8 is mislocalized in arl1Δ and ypt6Δ strains at 37°C. Cells were grown, then starved for nitrogen as described. FM 4–64 was used to stain the vacuolar membrane. Experiments were repeated 3 times and the results shown are from a single experiment. (A) Fluorescence images for WT, atg1Δ, arl1Δ and ypt6Δ in nonstarvation conditions. (B) Fluorescence images for WT, atg1Δ, arl1Δ and ypt6Δ in starvation conditions at 30°C. (C) Fluorescence images for WT, atg1Δ, arl1Δ and ypt6Δ in starvation conditions at 37°C. (D) The percentage of cells with Atg8 dots in 3 categories: 0, ≤ 2 and multiple dots (> 2 dots per cell) was quantified. At least 150 cells were counted for each strain. Error bars represent standard deviation from 3 biological replicates. Scale bar: 3 µm.

Figure 4. Arl1 and Ypt6 are required in the formation of the autophagosome at 37°C. (A) Illustration of the GFP-Atg8 proteinase protection assay. (B) GFP-Atg8 proteinase protection assay was done as indicated in Materials and Methods. The arl1Δ and ypt6Δ strains were cultured in SD-N medium at 37°C, while the atg1Δ and ypt7Δ strains were at 30°C. The cartoon underneath represents different structures for autophagy in the presence of trypsin. The boomerang represents the phagophore. The double circles represent the autophagosome.
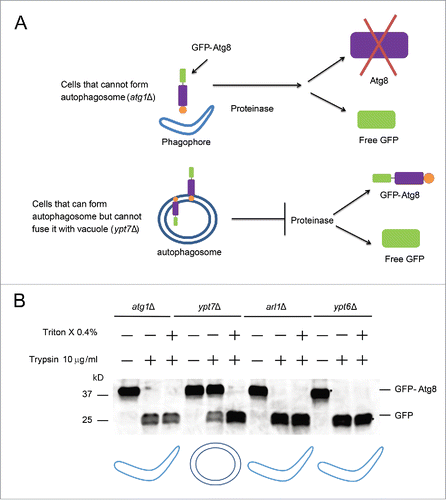
Figure 4. Arl1 and Ypt6 are required in the formation of the autophagosome at 37°C. (A) Illustration of the GFP-Atg8 proteinase protection assay. (B) GFP-Atg8 proteinase protection assay was done as indicated in Materials and Methods. The arl1Δ and ypt6Δ strains were cultured in SD-N medium at 37°C, while the atg1Δ and ypt7Δ strains were at 30°C. The cartoon underneath represents different structures for autophagy in the presence of trypsin. The boomerang represents the phagophore. The double circles represent the autophagosome.

Figure 5. The YPT6 ARL1 conditional double knockout strain is defective for autophagy at 30°C. The YSA021 strain, containing the ARL1AID allele, or the ypt6Δ strain was transformed with the pRS316-GFP-Atg8 plasmid. Cells were cultured until OD600 = 0.6 and divided into 2 portions. One portion was cultured with 1 mM NAA for 30 min, another one was with 0.17% ethanol alone. Autophagy was induced as described. For the YSA021 strain, after 3 h in SD-N medium, an aliquot of the + NAA culture was washed 3 times by SD-N medium and cells were cultured in SD-N medium without NAA for an additional 3 h. All the samples were collected and subjected to either Western blot with the anti-GFP antibody and anti-FLAG antibody, or live-cell fluorescence microscopy. (A) GFP-Atg8 assay shows the degradation of Arl1 caused the autophagy defect in the ypt6Δ strain background (YSA021) at 30°C. This defect can be reversed by washing out NAA (“washed”). (B) GFP-Atg8 assay shows that adding NAA to the ypt6Δ strain did not affect autophagy. (C) Fluorescence microcopy shows the punctate phenotype of mislocalized GFP-Atg8 after Arl1 was degraded. The diffuse green phenotype of normal autophagy reappeared after NAA was removed. Scale bar: 3 µm.
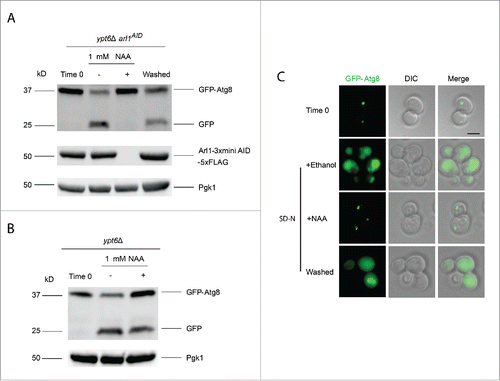
Figure 5. The YPT6 ARL1 conditional double knockout strain is defective for autophagy at 30°C. The YSA021 strain, containing the ARL1AID allele, or the ypt6Δ strain was transformed with the pRS316-GFP-Atg8 plasmid. Cells were cultured until OD600 = 0.6 and divided into 2 portions. One portion was cultured with 1 mM NAA for 30 min, another one was with 0.17% ethanol alone. Autophagy was induced as described. For the YSA021 strain, after 3 h in SD-N medium, an aliquot of the + NAA culture was washed 3 times by SD-N medium and cells were cultured in SD-N medium without NAA for an additional 3 h. All the samples were collected and subjected to either Western blot with the anti-GFP antibody and anti-FLAG antibody, or live-cell fluorescence microscopy. (A) GFP-Atg8 assay shows the degradation of Arl1 caused the autophagy defect in the ypt6Δ strain background (YSA021) at 30°C. This defect can be reversed by washing out NAA (“washed”). (B) GFP-Atg8 assay shows that adding NAA to the ypt6Δ strain did not affect autophagy. (C) Fluorescence microcopy shows the punctate phenotype of mislocalized GFP-Atg8 after Arl1 was degraded. The diffuse green phenotype of normal autophagy reappeared after NAA was removed. Scale bar: 3 µm.

Figure 6. Arl1 and Ypt6 are required for the anterograde trafficking of Atg9. mRFP-Ape1 and Atg9-3×GFP were integrated into the yeast genome at the APE1 and ATG9 loci, respectively. Cells were grown in YPD then transferred to SD-N medium as described. (A) Fluorescence images for atg1Δ (YSA009), atg1Δ arl1Δ (YSA010) and atg1Δ ypt6Δ (YSA011) strains under starvation conditions at 30°C. (B) Fluorescence images for atg1Δ (YSA009), atg1Δ arl1Δ (YSA010) and atg1Δ ypt6Δ (YSA011) strains under starvation conditions at 37°C, Arrows point to the additional Atg9 dots. (C) The percentage of the cells with more than 1 Atg9 dot in and . At least 50 cells were counted for each strain. Error bars represent standard deviation from 3 biological replicates. Scale bar: 5 µm.
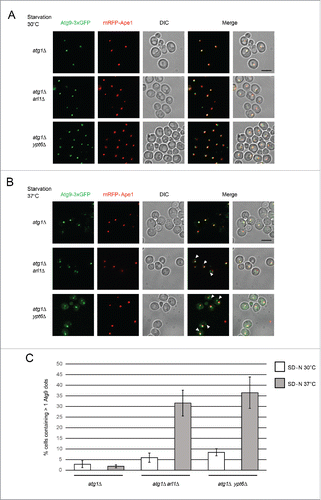
Figure 6. Arl1 and Ypt6 are required for the anterograde trafficking of Atg9. mRFP-Ape1 and Atg9-3×GFP were integrated into the yeast genome at the APE1 and ATG9 loci, respectively. Cells were grown in YPD then transferred to SD-N medium as described. (A) Fluorescence images for atg1Δ (YSA009), atg1Δ arl1Δ (YSA010) and atg1Δ ypt6Δ (YSA011) strains under starvation conditions at 30°C. (B) Fluorescence images for atg1Δ (YSA009), atg1Δ arl1Δ (YSA010) and atg1Δ ypt6Δ (YSA011) strains under starvation conditions at 37°C, Arrows point to the additional Atg9 dots. (C) The percentage of the cells with more than 1 Atg9 dot in Fig. 6A and 6B. At least 50 cells were counted for each strain. Error bars represent standard deviation from 3 biological replicates. Scale bar: 5 µm.

Figure 7. Arl1 and Ypt6 are required in the Cvt pathway. mRFP-Ape1 was integrated into the yeast genome using the pRS305-mRFP-Ape1 plasmid. Cells were grown and treated under starvation conditions as described. (A) Fluorescence images for WT (YSA005), atg1Δ (YSA006), arl1Δ (YSA007) and ypt6Δ (YSA008) strains in nonstarvation conditions. (B) The percentage of cells counted from that contain a red prApe1 dot rather than the diffuse red phenotype. Error bars represent the standard deviation from 3 biological replicates. At least 80 cells were counted for each strain. (C) Fluorescence images for WT (YSA005), atg1Δ (YSA006), arl1Δ (YSA007) and ypt6Δ (YSA008) strains under starvation conditions at 30°C. (D) Fluorescence images for WT (YSA005), atg1Δ (YSA006), arl1Δ (YSA007) and ypt6Δ (YSA008) strains under starvation conditions at 37°C. (E) prApe1 processing assay for WT, atg1Δ, arl1Δ and ypt6Δ strains under nonstarvation conditions (time 0), starvation for 3 h at 30°C and starvation for 3 h at 37°C. N, nitrogen. Scale bar: 3 µm.
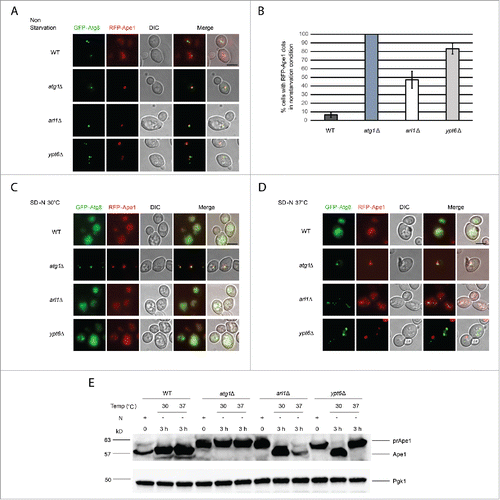
Figure 7. Arl1 and Ypt6 are required in the Cvt pathway. mRFP-Ape1 was integrated into the yeast genome using the pRS305-mRFP-Ape1 plasmid. Cells were grown and treated under starvation conditions as described. (A) Fluorescence images for WT (YSA005), atg1Δ (YSA006), arl1Δ (YSA007) and ypt6Δ (YSA008) strains in nonstarvation conditions. (B) The percentage of cells counted from Fig. 7A that contain a red prApe1 dot rather than the diffuse red phenotype. Error bars represent the standard deviation from 3 biological replicates. At least 80 cells were counted for each strain. (C) Fluorescence images for WT (YSA005), atg1Δ (YSA006), arl1Δ (YSA007) and ypt6Δ (YSA008) strains under starvation conditions at 30°C. (D) Fluorescence images for WT (YSA005), atg1Δ (YSA006), arl1Δ (YSA007) and ypt6Δ (YSA008) strains under starvation conditions at 37°C. (E) prApe1 processing assay for WT, atg1Δ, arl1Δ and ypt6Δ strains under nonstarvation conditions (time 0), starvation for 3 h at 30°C and starvation for 3 h at 37°C. N, nitrogen. Scale bar: 3 µm.

Figure 8. Arl1 and Ypt6 are required for GARP subunits Vps52 and Vps53 to be translocated to the PAS. ((A)– C) Fluorescence images of the yeast strains atg1Δ (YSA015), atg1Δ arl1Δ (YSA016) and atg1Δ ypt6Δ (YSA017) under nonstarvation conditions, starvation at 30°C and starvation at 37°C. Arrows point to the colocalization between Vps52-GFP and mRFP-Ape1. (D) The percentage of cells with colocalization between Vps52-GFP and mRFP-Ape1. At least 90 cells were counted for each strain at each condition. Error bars represent standard deviation from 3 biological replicates. ((E)– G) Fluorescence images of the yeast strain atg1Δ (YSA018), atg1Δ arl1Δ (YSA019) and atg1Δ ypt6Δ (YSA020) under nonstarvation conditions, starvation at 30°C and starvation at 37°C. Arrows point to the colocalization between Vps53-GFP and mRFP-Ape1. (H) The percentage of cells with colocalization between Vps53-GFP and mRFP-Ape1. At least 90 cells were counted for each strain under each condition. Error bars represent standard deviation from 3 biological replicates. Scale bar: 3 µm.
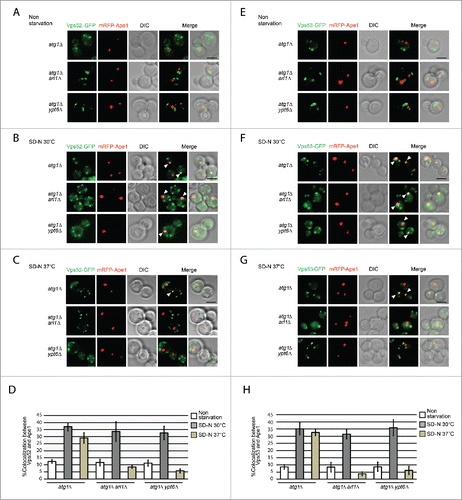
Figure 8. Arl1 and Ypt6 are required for GARP subunits Vps52 and Vps53 to be translocated to the PAS. ((A)– C) Fluorescence images of the yeast strains atg1Δ (YSA015), atg1Δ arl1Δ (YSA016) and atg1Δ ypt6Δ (YSA017) under nonstarvation conditions, starvation at 30°C and starvation at 37°C. Arrows point to the colocalization between Vps52-GFP and mRFP-Ape1. (D) The percentage of cells with colocalization between Vps52-GFP and mRFP-Ape1. At least 90 cells were counted for each strain at each condition. Error bars represent standard deviation from 3 biological replicates. ((E)– G) Fluorescence images of the yeast strain atg1Δ (YSA018), atg1Δ arl1Δ (YSA019) and atg1Δ ypt6Δ (YSA020) under nonstarvation conditions, starvation at 30°C and starvation at 37°C. Arrows point to the colocalization between Vps53-GFP and mRFP-Ape1. (H) The percentage of cells with colocalization between Vps53-GFP and mRFP-Ape1. At least 90 cells were counted for each strain under each condition. Error bars represent standard deviation from 3 biological replicates. Scale bar: 3 µm.

Figure 9. Model for Arl1 and Ypt6 in autophagy. Arl1 and Ypt6 regulate the targeting of the GARP complex to the PAS and the anterograde trafficking of Atg9. At the permissive temperature, Arl1 or Ypt6 alone is sufficient for the transport of GARP and Atg9 to the PAS. However, at the restrictive temperature, a single protein, Arl1 or Ypt6, is insufficient for targeting GARP to the PAS. Therefore under increased temperature, the anterograde trafficking of Atg9 to the PAS is impaired.
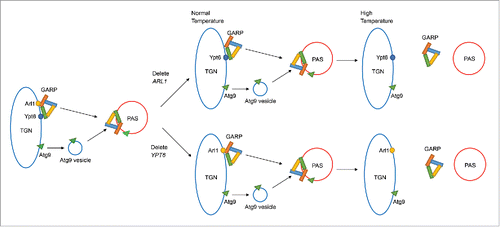
Figure 9. Model for Arl1 and Ypt6 in autophagy. Arl1 and Ypt6 regulate the targeting of the GARP complex to the PAS and the anterograde trafficking of Atg9. At the permissive temperature, Arl1 or Ypt6 alone is sufficient for the transport of GARP and Atg9 to the PAS. However, at the restrictive temperature, a single protein, Arl1 or Ypt6, is insufficient for targeting GARP to the PAS. Therefore under increased temperature, the anterograde trafficking of Atg9 to the PAS is impaired.
Supplemental material

KAUP_1196316_Supplemental_Figures_and_Tables.zip

Download Zip (5 MB)