2,302
Views
26
CrossRef citations to date
0
Altmetric
Basic Research Papers

Metastatic risk and resistance to BRAF inhibitors in melanoma defined by selective allelic loss of ATG5

, , , , , , , , , & show all
Pages 1776-1790 | Received 11 Nov 2015, Accepted 01 Jun 2016, Published online: 27 Jul 2016

Figures & data

Figure 1. Heterogeneous expression of core autophagy genes in melanoma and a broad spectrum of cancer types. GSEA heat map showing a differential enrichment of the indicated autophagy genes across the Cancer Cell Line Encyclopedia (CCLE), which encompasses a total of 917 cell lines of indicated tumor types. The Lysosome Gene Ontology gene set (GO:0005764), a melanoma-enriched feature, is included to visualize the distinct regulation of lysosomal-associated degradative processes. FDR values for the autophagy vs the lysosome GO set are indicated on the right.
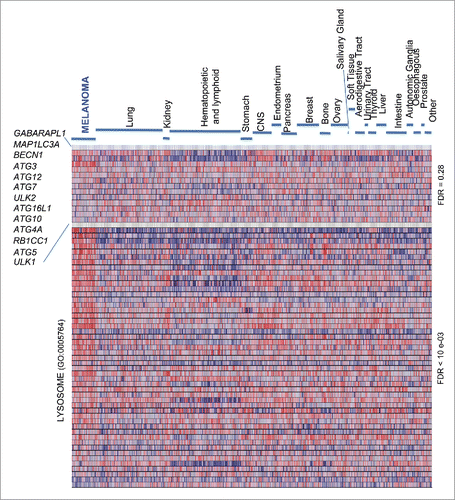
Figure 1. Heterogeneous expression of core autophagy genes in melanoma and a broad spectrum of cancer types. GSEA heat map showing a differential enrichment of the indicated autophagy genes across the Cancer Cell Line Encyclopedia (CCLE), which encompasses a total of 917 cell lines of indicated tumor types. The Lysosome Gene Ontology gene set (GO:0005764), a melanoma-enriched feature, is included to visualize the distinct regulation of lysosomal-associated degradative processes. FDR values for the autophagy vs the lysosome GO set are indicated on the right.

Figure 2. Consistent dowregulation of ATG5 mRNA expression in melanoma cell lines and tumor specimens. (A) Box plots depicting ATG5 mRNA expression (median centered intensity) across the indicated 19 tumor types (numbers of cell lines in parentheses) extracted from Oncomine from the Cancer Genome Project cell line dataset (E-MTAB-783; N = 732). P value for ATG5 downregulation in melanoma is indicated on the right. (B) mRNA expression (defined by RNA-Sequencing normalized to diploid cases by RSEM), as well as allelic number, missense and truncated mutations of core autophagy genes (color coded as indicated) in TCGA melanomas (N = 477 specimens). Shown is information extracted from cBioPortal for melanoma cases (numbered at the bottom) with alterations in the indicated factors.
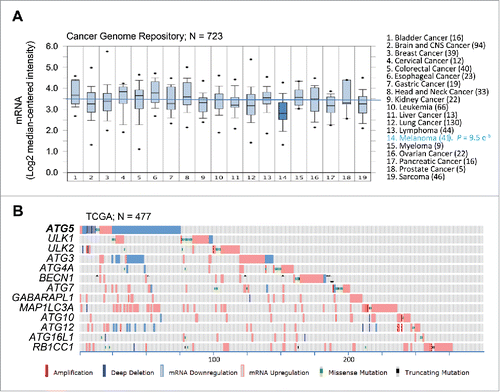
Figure 2. Consistent dowregulation of ATG5 mRNA expression in melanoma cell lines and tumor specimens. (A) Box plots depicting ATG5 mRNA expression (median centered intensity) across the indicated 19 tumor types (numbers of cell lines in parentheses) extracted from Oncomine from the Cancer Genome Project cell line dataset (E-MTAB-783; N = 732). P value for ATG5 downregulation in melanoma is indicated on the right. (B) mRNA expression (defined by RNA-Sequencing normalized to diploid cases by RSEM), as well as allelic number, missense and truncated mutations of core autophagy genes (color coded as indicated) in TCGA melanomas (N = 477 specimens). Shown is information extracted from cBioPortal for melanoma cases (numbered at the bottom) with alterations in the indicated factors.

Figure 3. ATG5 undergoes heterozygous copy number loss (shallow deletions) instead of hypermethylation in melanoma tumors. (A) mRNA expression (RNA sequence vs RSEM) as a function of promoter methylation status for ATG5 in the TCGA melanomas, with HOXD9 included as reference for a methylation-regulated gene in this tumor type. (B) Lack of correlation between ATG5 promoter methylation and overall patient survival in TCGA melanomas (N = 275). Indicated are Pearson (P) and Spearman rank (r) correlations. (C) ATG5 allelic loss in representative melanoma cell lines defined by FISH. Probes for ATG5 at 6q21 and an unrelated locus at 6p21 were labeled in red (R) and green (G), respectively. (D) ATG5 copy number in the indicated cell line data sets. (E) Graphical representation of the percentage of cases with the indicated alterations in the ATG5 gene in specimens with clinical annotations in the TCGA melanoma database (N = 366). Amp and del stand for amplifications and deletions, respectively.
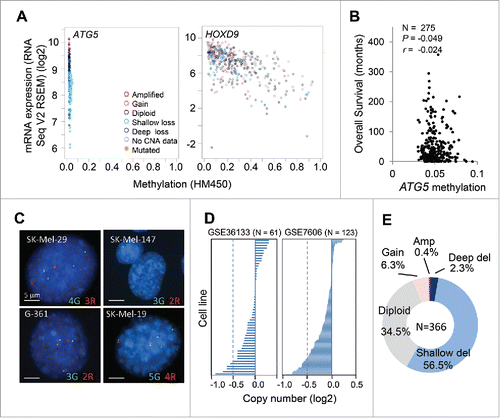
Figure 3. ATG5 undergoes heterozygous copy number loss (shallow deletions) instead of hypermethylation in melanoma tumors. (A) mRNA expression (RNA sequence vs RSEM) as a function of promoter methylation status for ATG5 in the TCGA melanomas, with HOXD9 included as reference for a methylation-regulated gene in this tumor type. (B) Lack of correlation between ATG5 promoter methylation and overall patient survival in TCGA melanomas (N = 275). Indicated are Pearson (P) and Spearman rank (r) correlations. (C) ATG5 allelic loss in representative melanoma cell lines defined by FISH. Probes for ATG5 at 6q21 and an unrelated locus at 6p21 were labeled in red (R) and green (G), respectively. (D) ATG5 copy number in the indicated cell line data sets. (E) Graphical representation of the percentage of cases with the indicated alterations in the ATG5 gene in specimens with clinical annotations in the TCGA melanoma database (N = 366). Amp and del stand for amplifications and deletions, respectively.

Figure 4. Prognostic value of shallow ATG5 deletions in melanoma not shared by other core autophagy genes. (A) Kaplan Meier curves for overall survival for melanoma patients with diploid, partial losses (shallow deletions) or deep deletions of the ATG5 locus (N = 255). Log-rank p value for shallow deletion vs diploid ATG5 content p = 0.0152. (B) Comparative distribution of TCGA melanoma patients at different stages of tumor progression (stage 0 to stage IV) as function of the genomic status of the ATG5, ATG3 or ATG10 loci (N = 255 melanomas). The corresponding genetic alterations are color coded as indicated. ND: cases with no defined staging classification. (C) Graphical representation of the distribution of genomic changes in the indicated autophagy genes in the TCGA melanomas. (D) Overall survival (log-rank p value) of patients with genetic changes and/or deregulated mRNA expression with respect to cases with diploid status of the indicated autophagy genes.
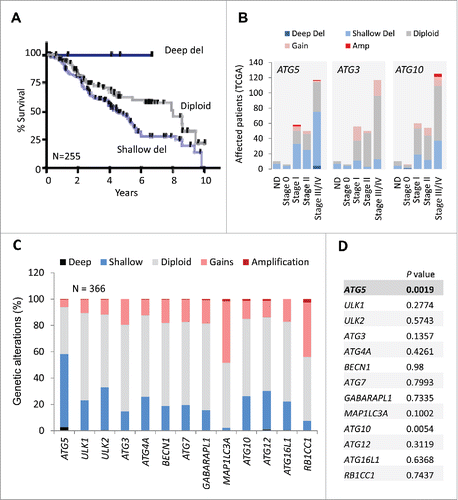
Figure 4. Prognostic value of shallow ATG5 deletions in melanoma not shared by other core autophagy genes. (A) Kaplan Meier curves for overall survival for melanoma patients with diploid, partial losses (shallow deletions) or deep deletions of the ATG5 locus (N = 255). Log-rank p value for shallow deletion vs diploid ATG5 content p = 0.0152. (B) Comparative distribution of TCGA melanoma patients at different stages of tumor progression (stage 0 to stage IV) as function of the genomic status of the ATG5, ATG3 or ATG10 loci (N = 255 melanomas). The corresponding genetic alterations are color coded as indicated. ND: cases with no defined staging classification. (C) Graphical representation of the distribution of genomic changes in the indicated autophagy genes in the TCGA melanomas. (D) Overall survival (log-rank p value) of patients with genetic changes and/or deregulated mRNA expression with respect to cases with diploid status of the indicated autophagy genes.

Figure 5. Prognostic features of ATG5 in melanoma not shared by neighboring genes at chromosome 6q21 or in other tumor types. (A) Schematic representation of genes mapping within 1 Mb upstream and downstream from the ATG5 locus at 6q21. (B) Comparative allelic status of ATG5 and PRDM1 in TCGA melanomas with respect to mRNA levels of these genes calculated by RSEM as a function of other diploid factors in this tumor. (C) Allelic status, mRNA expression, missense and truncated mutations (coded as depicted at the bottom) of the indicated genes in TCGA melanomas (N = 477 specimens, showing those with alterations in the indicated factors). Log-rank P values for overall survival (OS) estimated with respect to patients with no alterations in the indicated genes were extracted from cBioPortal for a 30-year observation period and are depicted on the right. (D) mRNA expression and allelic status of ATG5 in the indicated tumor types included in the TCGA. The number of specimens per tumor is indicated in parentheses, and the corresponding rate (%) of cases with shallow deletions of ATG5 are marked in blue. Log-rank p values for overall survival in patients with aggregate mRNA or copy number changes are also listed (in black).
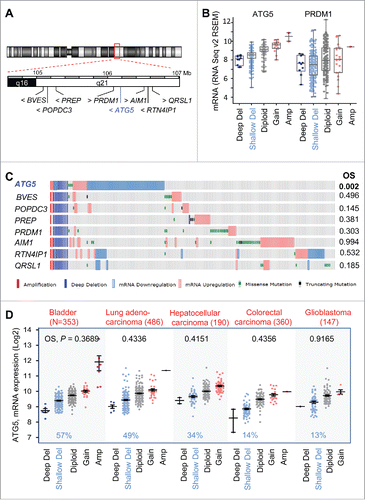
Figure 5. Prognostic features of ATG5 in melanoma not shared by neighboring genes at chromosome 6q21 or in other tumor types. (A) Schematic representation of genes mapping within 1 Mb upstream and downstream from the ATG5 locus at 6q21. (B) Comparative allelic status of ATG5 and PRDM1 in TCGA melanomas with respect to mRNA levels of these genes calculated by RSEM as a function of other diploid factors in this tumor. (C) Allelic status, mRNA expression, missense and truncated mutations (coded as depicted at the bottom) of the indicated genes in TCGA melanomas (N = 477 specimens, showing those with alterations in the indicated factors). Log-rank P values for overall survival (OS) estimated with respect to patients with no alterations in the indicated genes were extracted from cBioPortal for a 30-year observation period and are depicted on the right. (D) mRNA expression and allelic status of ATG5 in the indicated tumor types included in the TCGA. The number of specimens per tumor is indicated in parentheses, and the corresponding rate (%) of cases with shallow deletions of ATG5 are marked in blue. Log-rank p values for overall survival in patients with aggregate mRNA or copy number changes are also listed (in black).

Figure 6. Atg5 is dispensable for nevi formation driven by oncogenic BrafV600E in genetically modified mice. (A) Hyperproliferative pigmented lesions generated in the tamoxifen responsive Tyr::CreERT2;BrafCA/CA mice crossed to Atg5flox/flox animals for assessment of Atg5 gene dosage (Atg5+/−, Atg5+/Δ or atg5Δ/Δ) in the melanocytic compartment. Shown are images of lesions generated in ears, paws or the back skin (the latter in insets) captured 6 mo after tamoxifen induction. Equivalent anatomical areas in tamoxifen-untreated (noninduced) Tyr::CreERT2;BrafCA/CA;Atg5+/− control animals are also included as a reference. (B) Visualization of ATG5 protein levels by immunohistochemical staining (pink) of paraffin-embedded ear sections of animals of the indicated genotypes and treated as in (A). Nuclei were counterstained by hematoxilin. The brown color corresponds to melanin.
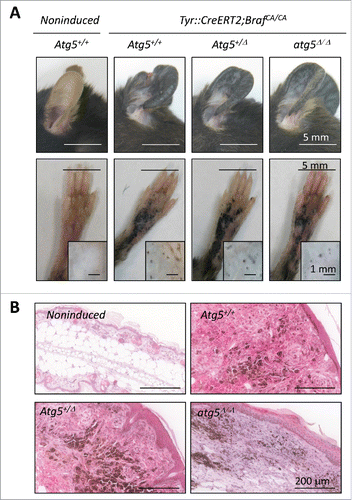
Figure 6. Atg5 is dispensable for nevi formation driven by oncogenic BrafV600E in genetically modified mice. (A) Hyperproliferative pigmented lesions generated in the tamoxifen responsive Tyr::CreERT2;BrafCA/CA mice crossed to Atg5flox/flox animals for assessment of Atg5 gene dosage (Atg5+/−, Atg5+/Δ or atg5Δ/Δ) in the melanocytic compartment. Shown are images of lesions generated in ears, paws or the back skin (the latter in insets) captured 6 mo after tamoxifen induction. Equivalent anatomical areas in tamoxifen-untreated (noninduced) Tyr::CreERT2;BrafCA/CA;Atg5+/− control animals are also included as a reference. (B) Visualization of ATG5 protein levels by immunohistochemical staining (pink) of paraffin-embedded ear sections of animals of the indicated genotypes and treated as in (A). Nuclei were counterstained by hematoxilin. The brown color corresponds to melanin.

Figure 7. Impact of Atg5 copy number on melanoma initiation and metastasis in vivo (melanocyte-specific and inducible mouse models). (A) Cutaneous melanomas generated in the melanocyte-specific Tyr::CreERT2;BrafCA/CA;Ptenflox/flox; Atg5flox/flox mice, bred to maintain (Atg5+/−) or undergo mono- or bi-allelic deletion of Atg5 (Atg5+/Δ or atg5Δ/Δ, respectively). The upper photographs were captured 3 wk after systemic administration of tamoxifen. Lower panels correspond to paraffin-embedded specimens processed for the detection of ATG5 protein expression (in pink). Nuclei were counterstained with hematoxylin. Brown staining corresponds to melanin. (B) Quantification of the average tumor number and size generated in animals as in (A), represented as mean −/+ SEM. (C) Higher metastatic potential of Tyr::CreERT2;BrafCA/CA;ptenΔ/Δ;Atg5+/Δ melanomas determined by macroscopic examinations of lungs 4 wk after tamoxifen administration and represented −/+ SEM. Here as in (B), P values corresponded to paired t test. (D) Lung micrometastases at low and high magnification (upper and lower panels, respectively) in the indicated mouse genotypes visualized by virtue of melanin-expressing colonies (brown, arrows). (E) Differential response of Tyr::CreERT2;BrafCA/CA;ptenΔ/Δ melanomas to dabrafenib depending on Atg5 copy number. Images correspond to representative lesions in the depilated back skin of the indicated animal groups, 4 wk after tamoxifen induction, and 3 wk of dabrafenib treatment (10 mg/kg orally, once a day). (F) Response rates measured as the reduction in tumor size vs averaged untreated controls of the Tyr::CreERT2;BrafCA/CA;ptenΔ/Δ driven melanomas of Atg5+/−, Atg5+/Δ or Atg5Δ/Δ backgrounds, represented as waterfall plots. (G) Size distribution (mm2) of control and dabrafenib-treated cutaneous lesions of the indicated genotypes.
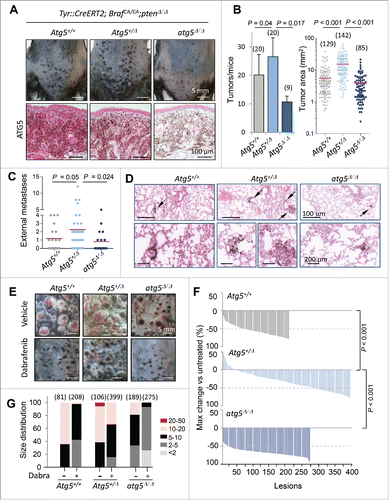
Figure 7. Impact of Atg5 copy number on melanoma initiation and metastasis in vivo (melanocyte-specific and inducible mouse models). (A) Cutaneous melanomas generated in the melanocyte-specific Tyr::CreERT2;BrafCA/CA;Ptenflox/flox; Atg5flox/flox mice, bred to maintain (Atg5+/−) or undergo mono- or bi-allelic deletion of Atg5 (Atg5+/Δ or atg5Δ/Δ, respectively). The upper photographs were captured 3 wk after systemic administration of tamoxifen. Lower panels correspond to paraffin-embedded specimens processed for the detection of ATG5 protein expression (in pink). Nuclei were counterstained with hematoxylin. Brown staining corresponds to melanin. (B) Quantification of the average tumor number and size generated in animals as in (A), represented as mean −/+ SEM. (C) Higher metastatic potential of Tyr::CreERT2;BrafCA/CA;ptenΔ/Δ;Atg5+/Δ melanomas determined by macroscopic examinations of lungs 4 wk after tamoxifen administration and represented −/+ SEM. Here as in (B), P values corresponded to paired t test. (D) Lung micrometastases at low and high magnification (upper and lower panels, respectively) in the indicated mouse genotypes visualized by virtue of melanin-expressing colonies (brown, arrows). (E) Differential response of Tyr::CreERT2;BrafCA/CA;ptenΔ/Δ melanomas to dabrafenib depending on Atg5 copy number. Images correspond to representative lesions in the depilated back skin of the indicated animal groups, 4 wk after tamoxifen induction, and 3 wk of dabrafenib treatment (10 mg/kg orally, once a day). (F) Response rates measured as the reduction in tumor size vs averaged untreated controls of the Tyr::CreERT2;BrafCA/CA;ptenΔ/Δ driven melanomas of Atg5+/−, Atg5+/Δ or Atg5Δ/Δ backgrounds, represented as waterfall plots. (G) Size distribution (mm2) of control and dabrafenib-treated cutaneous lesions of the indicated genotypes.
Supplemental material

Supplementary files

Download Zip (1.3 MB)

Reprints and Corporate Permissions

Please note: Selecting permissions does not provide access to the full text of the article, please see our help page How do I view content?

To request a reprint or corporate permissions for this article, please click on the relevant link below:

Academic Permissions

Please note: Selecting permissions does not provide access to the full text of the article, please see our help page How do I view content?

Obtain permissions instantly via Rightslink by clicking on the button below:

If you are unable to obtain permissions via Rightslink, please complete and submit this Permissions form. For more information, please visit our Permissions help page.