2,341
Views
40
CrossRef citations to date
0
Altmetric
Basic Research Papers

MicroRNA expression profiling of Leishmania donovani-infected host cells uncovers the regulatory role of MIR30A-3p in host autophagy

, , &
Pages 1817-1831 | Received 27 Jul 2015, Accepted 15 Jun 2016, Published online: 19 Aug 2016

Figures & data

Figure 1. Heat map and hierarchical clustering of infection-specific miRNAs. Heat map and hierarchical clustering of 38 infection-specific differentially expressed key miRNAs in THP-1 cells in response to Leishmania infection at 45 min, 6 h and 24 h as compared to uninfected control. The heat-map shows several members of key families of miRNAs (let-7, MIR30, MIR17, MIR15 and MIR9) differentially modulated across different time points. The miRNA expression values are presented using a red (upregulated), black (median value) and green (downregulated) color scheme.
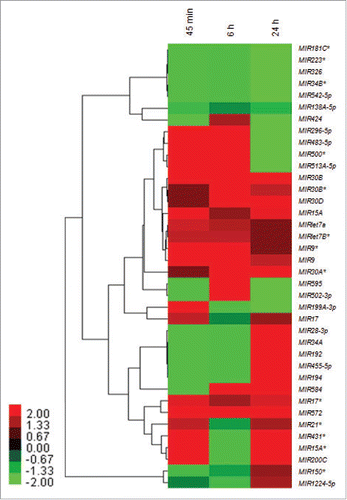
Figure 1. Heat map and hierarchical clustering of infection-specific miRNAs. Heat map and hierarchical clustering of 38 infection-specific differentially expressed key miRNAs in THP-1 cells in response to Leishmania infection at 45 min, 6 h and 24 h as compared to uninfected control. The heat-map shows several members of key families of miRNAs (let-7, MIR30, MIR17, MIR15 and MIR9) differentially modulated across different time points. The miRNA expression values are presented using a red (upregulated), black (median value) and green (downregulated) color scheme.

Figure 2. Induction of the Leishmania-specific MIR30 family of miRNAs. The MIR30 family of miRNAs is induced in macrophages infected with L. donovani. Expression levels of different miRNAs were examined in THP-1 cells infected with L. donovani with a multiplicity of infection (MOI) of 10 at different time-points (A) MIR30B, (B) MIR30D and (C) MIR30A-3p. The expression levels were also examined in human peripheral blood monocyte-derived macrophages (HsMDMs) infected with L. donovani with an MOI of 10 at different time-points (D) MIR30B, (E) MIR30D and (F) MIR30A-3p. Expression of let-7a (G) and let-7b* (H) in THP-1 cells infected with L. donovani. The graphical data points represent mean of 3 replicate experiments ± standard error mean (SEM). (Mann-Whitney test; **, P < 0.001; *, P < 0.05). U44 Small RNA (RNU44A) was used as an internal control. Data analysis was performed using 2-ΔΔCt method.
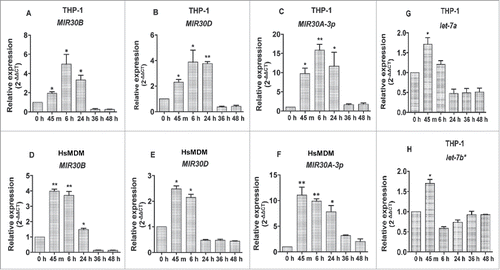
Figure 2. Induction of the Leishmania-specific MIR30 family of miRNAs. The MIR30 family of miRNAs is induced in macrophages infected with L. donovani. Expression levels of different miRNAs were examined in THP-1 cells infected with L. donovani with a multiplicity of infection (MOI) of 10 at different time-points (A) MIR30B, (B) MIR30D and (C) MIR30A-3p. The expression levels were also examined in human peripheral blood monocyte-derived macrophages (HsMDMs) infected with L. donovani with an MOI of 10 at different time-points (D) MIR30B, (E) MIR30D and (F) MIR30A-3p. Expression of let-7a (G) and let-7b* (H) in THP-1 cells infected with L. donovani. The graphical data points represent mean of 3 replicate experiments ± standard error mean (SEM). (Mann-Whitney test; **, P < 0.001; *, P < 0.05). U44 Small RNA (RNU44A) was used as an internal control. Data analysis was performed using 2-ΔΔCt method.

Table 1. Pattern of the let-7 and MIR30 families of microRNAs that were differentially expressed in THP-1 cells after L. donovani infection and the key experimentally validated gene targets as identified by the miRNA target-prediction tool, miRWalk.

Figure 3. Induction of autophagy in THP-1 cells in response to Leishmania infection. (A) THP-1 cells were infected with promastigotes of L. donovani for 24, 36 and 48 h. Cells were subsequently fixed and immunostaining was carried out using anti-LC3B antibody (green) to detect the autophagosomes. DRAQ5 staining (red) was performed to detect cell nuclei and infected Leishmania parasites. Uninfected THP-1 cells were used as control cells to compare the status of autophagy in Leishmania-infected cells. Rapamycin (100 nM) was used as an inducer of autophagy in THP-1 cells. Merged images show colocalization of parasites and LC3-II foci (yellow). The zoomed confocal photomicrographs show localization of LC3-II puncta around Leishmania parasites in macrophages infected with parasites. Confocal microscopy was performed to acquire images. Scale bars: 10 μm for 63x images. Experiments were repeated 3 times, the images shown are representative of a single experiment. (B) Bar diagram showing number of LC3-II puncta per macrophage. To access the number of puncta per cell, approximately 100 cells were counted for the number of puncta for each condition. (Student t test; ***, P < 0.001; ** , P < 0.01; * , P < 0.05). (C) THP-1 cells were infected with L. donovani for 12, 24, 36 and 48 h. Protein levels of LC3 were detected by western blot in the cell lysates using anti-LC3B antibody. Cell lysates derived from rapamycin (100 nM) treated cells were used as positive control. Densitometric analysis shows the fold change in expression of LC3-II (autophagy marker) in THP-1 cells infected with L. donovani. TUBB was used as the loading control. The data are representative of 3 independent experiments. (Unpaired t test with the Welch correction; *, P < 0.05). Rapa, rapamycin.
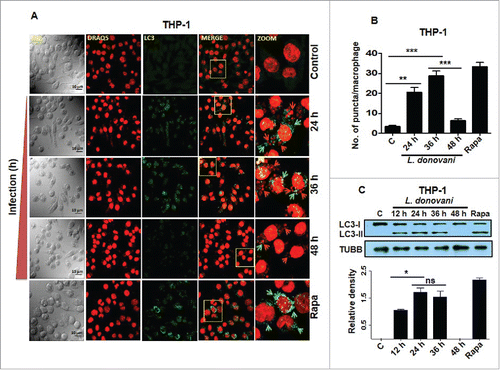
Figure 3. Induction of autophagy in THP-1 cells in response to Leishmania infection. (A) THP-1 cells were infected with promastigotes of L. donovani for 24, 36 and 48 h. Cells were subsequently fixed and immunostaining was carried out using anti-LC3B antibody (green) to detect the autophagosomes. DRAQ5 staining (red) was performed to detect cell nuclei and infected Leishmania parasites. Uninfected THP-1 cells were used as control cells to compare the status of autophagy in Leishmania-infected cells. Rapamycin (100 nM) was used as an inducer of autophagy in THP-1 cells. Merged images show colocalization of parasites and LC3-II foci (yellow). The zoomed confocal photomicrographs show localization of LC3-II puncta around Leishmania parasites in macrophages infected with parasites. Confocal microscopy was performed to acquire images. Scale bars: 10 μm for 63x images. Experiments were repeated 3 times, the images shown are representative of a single experiment. (B) Bar diagram showing number of LC3-II puncta per macrophage. To access the number of puncta per cell, approximately 100 cells were counted for the number of puncta for each condition. (Student t test; ***, P < 0.001; ** , P < 0.01; * , P < 0.05). (C) THP-1 cells were infected with L. donovani for 12, 24, 36 and 48 h. Protein levels of LC3 were detected by western blot in the cell lysates using anti-LC3B antibody. Cell lysates derived from rapamycin (100 nM) treated cells were used as positive control. Densitometric analysis shows the fold change in expression of LC3-II (autophagy marker) in THP-1 cells infected with L. donovani. TUBB was used as the loading control. The data are representative of 3 independent experiments. (Unpaired t test with the Welch correction; *, P < 0.05). Rapa, rapamycin.

Figure 4. Effect of MIR30A-3p expression on autophagy in Leishmania-infected THP-1 cells and HsMDMs. (A) THP-1 cells and HsMDMs were transfected with the MIR30A-3p mimic (lane 3) and the MIR30A-3p inhibitor (lane 5) for 36 h. Cells transfected with the MIR30A-3p mimic (lane 4) and the MIR30A-3p inhibitor (lane 6) were further infected with L. donovani for 24 h. Cell lysates from uninfected control cells (lane 1) and macrophages infected with L. donovani (lane 2) were used as controls to compare the LC3-II expression, as a marker of autophagy. Protein levels of LC3 were detected by western blot in the cell lysates using anti-LC3B antibody. (B) Densitometric analysis shows the fold change in expression of LC3-II (autophagy marker) in both THP-1 and HsMDM infected with L. donovani. TUBB was used as the loading control. Western blot images are representative of 3 independent experiments. (Unpaired t test with the Welch correction; ***, P < 0.0001; **, P < 0.001; *, P < 0.05); LD: Leishmania donovani; Infect., Infection; HsMDM, human monocyte-derived macrophages.
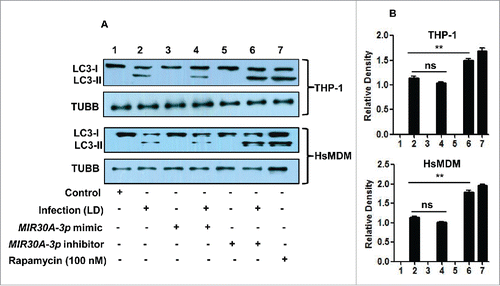
Figure 4. Effect of MIR30A-3p expression on autophagy in Leishmania-infected THP-1 cells and HsMDMs. (A) THP-1 cells and HsMDMs were transfected with the MIR30A-3p mimic (lane 3) and the MIR30A-3p inhibitor (lane 5) for 36 h. Cells transfected with the MIR30A-3p mimic (lane 4) and the MIR30A-3p inhibitor (lane 6) were further infected with L. donovani for 24 h. Cell lysates from uninfected control cells (lane 1) and macrophages infected with L. donovani (lane 2) were used as controls to compare the LC3-II expression, as a marker of autophagy. Protein levels of LC3 were detected by western blot in the cell lysates using anti-LC3B antibody. (B) Densitometric analysis shows the fold change in expression of LC3-II (autophagy marker) in both THP-1 and HsMDM infected with L. donovani. TUBB was used as the loading control. Western blot images are representative of 3 independent experiments. (Unpaired t test with the Welch correction; ***, P < 0.0001; **, P < 0.001; *, P < 0.05); LD: Leishmania donovani; Infect., Infection; HsMDM, human monocyte-derived macrophages.

Figure 5. Expression of MIR30A-3p influences intracellular burden of Leishmania parasites in THP-1 cells. (A) THP-1 differentiated macrophages were transfected with the MIR30A-3p mimic or the MIR30A-3p inhibitor for 48 h followed by infection with promastigotes of L. donovani (MOI of 10). Cells were fixed and subsequently stained with fluorescent nucleic acid probe, DRAQ5. Confocal microscopy was performed to assess the parasite burden. The image is a representative field among multiple random fields analyzed for scoring average parasite number per macrophage from a minimum of 100 infected cells counted from at least 10 fields. Arrows indicate infected parasites, scale bars: 10 μm for 63x images. Bar diagram showing average number of parasites per THP-1 cells (B). To assess the parasite burden, at least 100 macrophages were counted for the number of parasites in each condition of manipulation. The statistical significance was determined by using the Student t test (***, P < 0.001; **, P < 0.01; *, P < 0.05). LD, Leishmania donovani.
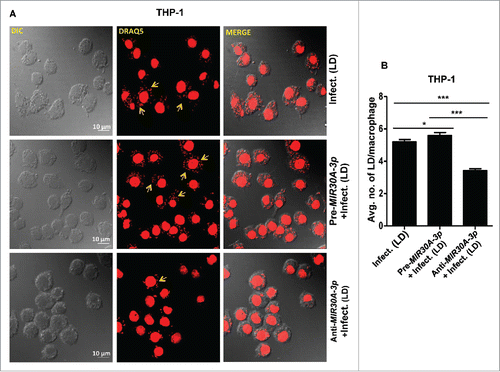
Figure 5. Expression of MIR30A-3p influences intracellular burden of Leishmania parasites in THP-1 cells. (A) THP-1 differentiated macrophages were transfected with the MIR30A-3p mimic or the MIR30A-3p inhibitor for 48 h followed by infection with promastigotes of L. donovani (MOI of 10). Cells were fixed and subsequently stained with fluorescent nucleic acid probe, DRAQ5. Confocal microscopy was performed to assess the parasite burden. The image is a representative field among multiple random fields analyzed for scoring average parasite number per macrophage from a minimum of 100 infected cells counted from at least 10 fields. Arrows indicate infected parasites, scale bars: 10 μm for 63x images. Bar diagram showing average number of parasites per THP-1 cells (B). To assess the parasite burden, at least 100 macrophages were counted for the number of parasites in each condition of manipulation. The statistical significance was determined by using the Student t test (***, P < 0.001; **, P < 0.01; *, P < 0.05). LD, Leishmania donovani.

Figure 6. Expression of MIR30A-3p influences intracellular burden of Leishmania parasites in HsMDMs. (A) HsMDMs were transfected with the MIR30A-3p mimic or the MIR30A-3p inhibitor for 48 h followed by infection with promastigotes of L. donovani (MOI of 10). Cells were fixed and subsequently stained with the fluorescent nucleic acid probe, DRAQ5. Confocal microscopy was performed to assess the parasite burden. The image is a representative field among multiple random fields analyzed for scoring average parasite number per macrophage from a minimum of 100 infected cells counted from at least 10 fields. Arrows indicate infected parasites, scale bars: 10 μm for 63x images. Bar diagram showing average number of parasites per cell (B). To assess the parasite burden, at least 100 macrophages were counted for the number of parasites in each condition of manipulation. The statistical significance was determined by using the Student t test (***, P < 0.001; **, P < 0.01; *, P < 0.05). DIC, differential interference contrast; HsMDM, human monocyte-derived macrophages; LD, Leishmania donovani.
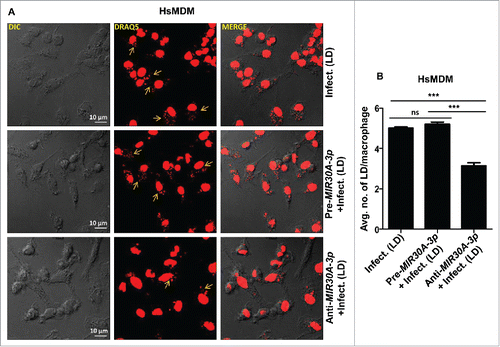
Figure 6. Expression of MIR30A-3p influences intracellular burden of Leishmania parasites in HsMDMs. (A) HsMDMs were transfected with the MIR30A-3p mimic or the MIR30A-3p inhibitor for 48 h followed by infection with promastigotes of L. donovani (MOI of 10). Cells were fixed and subsequently stained with the fluorescent nucleic acid probe, DRAQ5. Confocal microscopy was performed to assess the parasite burden. The image is a representative field among multiple random fields analyzed for scoring average parasite number per macrophage from a minimum of 100 infected cells counted from at least 10 fields. Arrows indicate infected parasites, scale bars: 10 μm for 63x images. Bar diagram showing average number of parasites per cell (B). To assess the parasite burden, at least 100 macrophages were counted for the number of parasites in each condition of manipulation. The statistical significance was determined by using the Student t test (***, P < 0.001; **, P < 0.01; *, P < 0.05). DIC, differential interference contrast; HsMDM, human monocyte-derived macrophages; LD, Leishmania donovani.

Figure 7. Expression pattern of BECN1 and ATG3 in macrophages infected with L. donovani across different time points. Bar diagrams showing fold expression of (A) BECN1 and (B) ATG3 in Leishmania-infected THP-1 cells and HsMDMs (C and D) as compared to uninfected control. The expression pattern was accessed by quantitative real-time qRT-PCR. The qRT-PCR data shown represents mean values obtained from 3 independent experiments. U6 small nuclear 1 RNA (RNU6-1) was used as the endogenous control. Data analysis was performed using 2-ΔΔCt method. (Mann-Whitney test; ***, P < 0.001; **, P < 0.01; *, P < 0.05). Western blot showing time-dependent expression of BECN1 and ATG3 in THP-1 (E) cells and HsMDMs (F) infected with Leishmania donovani. TUBB was used as the loading control. Western blot images are representative of 3 independent experiments.
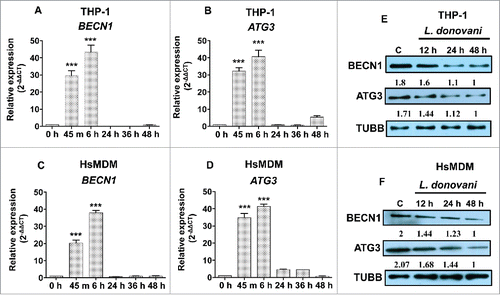
Figure 7. Expression pattern of BECN1 and ATG3 in macrophages infected with L. donovani across different time points. Bar diagrams showing fold expression of (A) BECN1 and (B) ATG3 in Leishmania-infected THP-1 cells and HsMDMs (C and D) as compared to uninfected control. The expression pattern was accessed by quantitative real-time qRT-PCR. The qRT-PCR data shown represents mean values obtained from 3 independent experiments. U6 small nuclear 1 RNA (RNU6-1) was used as the endogenous control. Data analysis was performed using 2-ΔΔCt method. (Mann-Whitney test; ***, P < 0.001; **, P < 0.01; *, P < 0.05). Western blot showing time-dependent expression of BECN1 and ATG3 in THP-1 (E) cells and HsMDMs (F) infected with Leishmania donovani. TUBB was used as the loading control. Western blot images are representative of 3 independent experiments.

Figure 8. BECN1 expression pattern in macrophages infected with Leishmania. Confocal photomicrographs showing BECN1 expression and infected parasites in THP-1 cells infected with L. donovani. THP-1 cells were infected with promastigotes of Leishmania and were allowed to proliferate for 24, 36 and 48 h postinfection. Uninfected cells were used as controls to compare the level of BECN1 across different times. Cells were subsequently fixed and immunostaining was carried out using anti-BECN1 antibody (green). A fluorescent nucleic acid probe, DRAQ5 (red), was used to stain cell nuclei of macrophages and parasites. Scale bars: 10 μm for 63x images. Confocal microscopy was performed to acquire images. Experiments were repeated 3 times; the images shown are representatives of a single experiment.
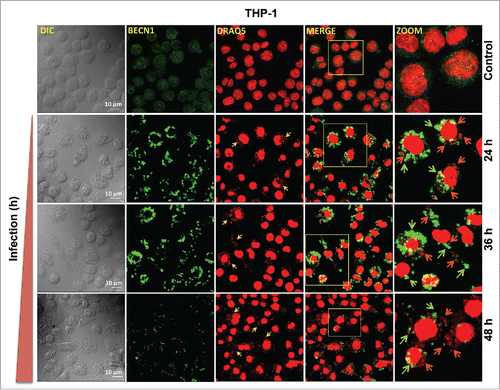
Figure 8. BECN1 expression pattern in macrophages infected with Leishmania. Confocal photomicrographs showing BECN1 expression and infected parasites in THP-1 cells infected with L. donovani. THP-1 cells were infected with promastigotes of Leishmania and were allowed to proliferate for 24, 36 and 48 h postinfection. Uninfected cells were used as controls to compare the level of BECN1 across different times. Cells were subsequently fixed and immunostaining was carried out using anti-BECN1 antibody (green). A fluorescent nucleic acid probe, DRAQ5 (red), was used to stain cell nuclei of macrophages and parasites. Scale bars: 10 μm for 63x images. Confocal microscopy was performed to acquire images. Experiments were repeated 3 times; the images shown are representatives of a single experiment.

Figure 9. MIR30A-3p specifically targets BECN1 and ATG3. Downregulation of BECN1 and ATG3 in THP-1 cells (A and B) and HsMDM (D and E) transfected with the MIR30A-3p mimic. Macrophages were transfected with the MIR30A-3p mimic (25 nM), RNA was isolated (48 h post-transfection) and quantitative real-time RT-PCR was performed to access the expression status of BECN1 and ATG3. The control mimic for MIR30A-3p was used as a negative control. qRT-PCR data shown here represent mean values obtained from 3 independent experiments. RNU6-1 was used as the endogenous control. Data analysis was performed using 2-ΔΔCt method. (Mann-Whitney test; *, P < 0.05). Downregulation of BECN1 and ATG3 in THP-1 cells (C) and HsMDM (F) transfected with the MIR30A-3p mimic. Macrophages were transfected with the MIR30A-3p mimic (25 nM) and the corresponding control mimic for 48 h. Cell lysates from control THP-1 cells and cells transfected with the miR-mimic for MIR30A-3p, control mimic and cells treated with transfection reagent were probed for BECN1 and ATG3 expression using corresponding primary antibodies. TUBB was used the loading control. The data are representative of 3 independent experiments. HsMDM, human monocyte-derived macrophages. Cell cont, cell control; Transf. cont, transfection control.
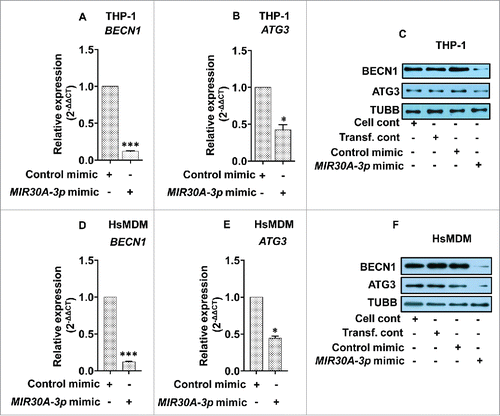
Figure 9. MIR30A-3p specifically targets BECN1 and ATG3. Downregulation of BECN1 and ATG3 in THP-1 cells (A and B) and HsMDM (D and E) transfected with the MIR30A-3p mimic. Macrophages were transfected with the MIR30A-3p mimic (25 nM), RNA was isolated (48 h post-transfection) and quantitative real-time RT-PCR was performed to access the expression status of BECN1 and ATG3. The control mimic for MIR30A-3p was used as a negative control. qRT-PCR data shown here represent mean values obtained from 3 independent experiments. RNU6-1 was used as the endogenous control. Data analysis was performed using 2-ΔΔCt method. (Mann-Whitney test; *, P < 0.05). Downregulation of BECN1 and ATG3 in THP-1 cells (C) and HsMDM (F) transfected with the MIR30A-3p mimic. Macrophages were transfected with the MIR30A-3p mimic (25 nM) and the corresponding control mimic for 48 h. Cell lysates from control THP-1 cells and cells transfected with the miR-mimic for MIR30A-3p, control mimic and cells treated with transfection reagent were probed for BECN1 and ATG3 expression using corresponding primary antibodies. TUBB was used the loading control. The data are representative of 3 independent experiments. HsMDM, human monocyte-derived macrophages. Cell cont, cell control; Transf. cont, transfection control.

Figure 10. Leishmania-specific downregulation of BECN1 is mediated by MIR30A-3p. Effect of MIR30A-3p on BECN1 expression in THP-1 cells (A) and human peripheral blood monocyte derived macrophages (B) infected with L. donovani. Cells were transfected with the MIR30A-3p mimic (lane 3) and the MIR30A-3p inhibitor (lane 4) for 48 h. Cells transfected with the MIR30A-3p mimic (lane 5) and the MIR30A-3p inhibitor (lane 6) for 48 h were further infected with L. donovani for 36 h. Cell lysates from uninfected cells (lane 1) and cells infected with L. donovani for 36 h (lane 2) were used as controls to compare the expression status of BECN1. Protein levels of BECN1 were detected by western blot in the cell lysates using anti-BECN1 antibody. TUBB was used as the loading control. The data are representative of 3 independent experiments. Bar diagram showing fold-changes in protein expression using densitometric analysis of the corresponding western blot of THP-1 cells (C) and HsMDM (D). (Unpaired t test with the Welch correction; ***, P < 0.001; **, P < 0.01; *, P < 0.05). cont., control; LD, L. donovani; HsMDM, human monocyte-derived macrophages.
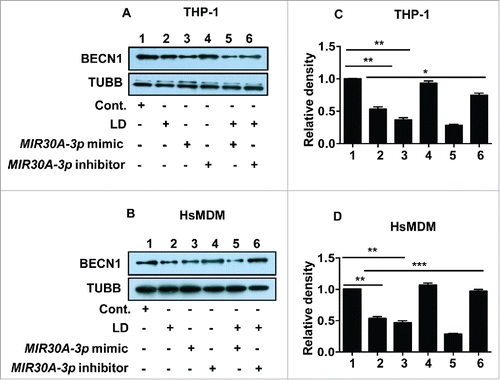
Figure 10. Leishmania-specific downregulation of BECN1 is mediated by MIR30A-3p. Effect of MIR30A-3p on BECN1 expression in THP-1 cells (A) and human peripheral blood monocyte derived macrophages (B) infected with L. donovani. Cells were transfected with the MIR30A-3p mimic (lane 3) and the MIR30A-3p inhibitor (lane 4) for 48 h. Cells transfected with the MIR30A-3p mimic (lane 5) and the MIR30A-3p inhibitor (lane 6) for 48 h were further infected with L. donovani for 36 h. Cell lysates from uninfected cells (lane 1) and cells infected with L. donovani for 36 h (lane 2) were used as controls to compare the expression status of BECN1. Protein levels of BECN1 were detected by western blot in the cell lysates using anti-BECN1 antibody. TUBB was used as the loading control. The data are representative of 3 independent experiments. Bar diagram showing fold-changes in protein expression using densitometric analysis of the corresponding western blot of THP-1 cells (C) and HsMDM (D). (Unpaired t test with the Welch correction; ***, P < 0.001; **, P < 0.01; *, P < 0.05). cont., control; LD, L. donovani; HsMDM, human monocyte-derived macrophages.
Supplemental material

Supplementary files

Download Zip (182 KB)

Reprints and Corporate Permissions

Please note: Selecting permissions does not provide access to the full text of the article, please see our help page How do I view content?

To request a reprint or corporate permissions for this article, please click on the relevant link below:

Academic Permissions

Please note: Selecting permissions does not provide access to the full text of the article, please see our help page How do I view content?

Obtain permissions instantly via Rightslink by clicking on the button below:

If you are unable to obtain permissions via Rightslink, please complete and submit this Permissions form. For more information, please visit our Permissions help page.