Figures & data
Figure 1. Effects of Atg5 ablation on double-membrane vesicle formation, cytokine gene expression, and protein secretion. (A) Atg5 gene expression in Atg5 CKO Mφs (n = 3 mice) vs. floxed controls (n = 3 mice) as measured by qPCR. Student t test ****, P < 0.0001. (B) Representative electron micrographs of a Atg5fl/fl control or Atg5 CKO peritoneal Mφ. (C) Representative western blot from Mφ cell lysates treated with LPS alone or LPS and bafilomycin A1 for 18 h in culture. (D) Representative qPCR gene expression analyses of Mφ polarization markers (M1 markers Il1B (n = 4 vs n = 4 mice), Il6 (n = 4 vs n = 10 mice), Nos2 (n = 4 vs n = 4 mice), Ccl2 (n = 2 vs n = 6 mice), and Ptgs2 (n = 2 vs n = 6 mice) and M2 markers Il10 (n = 4 vs n = 10 mice) and Arg1 (arginase, liver; n = 2 vs n = 6 mice) from baseline or LPS-treated Atg5CKO Mφs and controls. One-way ANOVA with the Tukey post-hoc test **, P < 0.01; ***, P < 0.001. (E) IL6 (n = 7 vs n = 6) and (F) IL1B (n = 7 vs n = 6) secretion by Atg5fl/fl control or Atg5 CKO conditional knockout peritoneal Mφ at baseline or following 24 h of LPS stimulation in culture (n = 2 vs n = 2). One-way ANOVA with the Tukey post-hoc test **, P < 0.01; ***, P < 0.001. (G) TLR4 surface levels from Atg5 CKO (n = 12 mice) or control (n = 11 mice) peritoneal Mφs following INFG priming or INFG priming plus LPS stimulation as measured by FACS analysis. Ns, not significant. All data are represented as mean ± SEM.
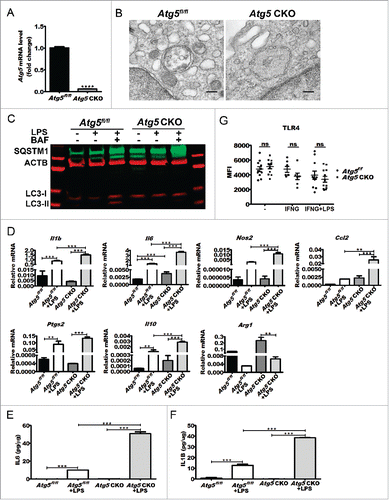
Figure 2. Atg5 CKO mice develop severe uveitis and undergo a cytokine storm. (A) Representative concavalin A lectin perfused (top; scale bar: 100 µm) or PECAM1 (platelet/endothelial cell adhesion molecule 1) and PTPRC (protein tyrosine phosphatase, receptor type, C) costained (bottom; scale bar: 20 µm) retinal vasculature whole mount images from Atg5fl/fl control (n = 10) or Atg5 CKO (n = 10) conditional knockout mice 24 h postuveitis initiation by 10 mg/kg bacterial LPS and quantification of retinal leukostasis (graph). Student t test ****, P < 0.0001. (B) IL6, IL1B, and IL10 serum levels in Atg5 CKO (n = 3 mice) and control mice (n = 3) 6 h postLPS treatment. Student t test *, P < 0.05; **, P < 0.01. (C) Representative histology from Atg5fl/fl control (n = 19) or Atg5 CKO (n = 17) conditional knockout mice treated with 200 µg RBP31-20 to induce EAU (top; scale bar: 200 µm) with corresponding fundus (top) and OCT imaging (middle), and EAU grading (bottom). The black line in the eye fundus photo indicates the area used for the OCT image below. Arrows in Atg5 CKO images indicate an area of intra-retinal abnormality that was observed across histology, fundus imaging and OCT imaging. Mann-Whitney U-test *, P < 0.05 (D) IL6 serum levels 3, 7 or 28 d postRBP31-20 inoculation to initiate EAU in Atg5 CKO (n = 5) or floxed control (n = 4) mice. All data are represented as mean ± SEM.
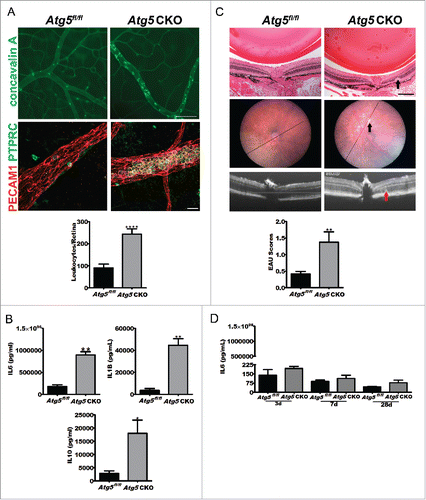
Figure 3. Loss of autophagy promotes uveitis. Representative images of concavalin A lectin- perfused retinal flatmounts from Rb1cc1 CKO (n = 17 vs. n = 10), Atg14 CKO (n = 8 vs. n = 16), Atg16l1 CKO (n = 7 vs. n = 14), Atg7 CKO (n = 9 vs n = 7), and Atg3 CKO (n = 17 vs n = 8) mice and littermate controls with corresponding quantification of adhered leukocytes per retina and serum IL1B levels for each genotype. Scale bar: 100 µm. All data are represented as mean ± SEM. Student t test or Mann-Whitney U-test *, P < 0.05; **, P < 0.01; ***, P < 0.001.
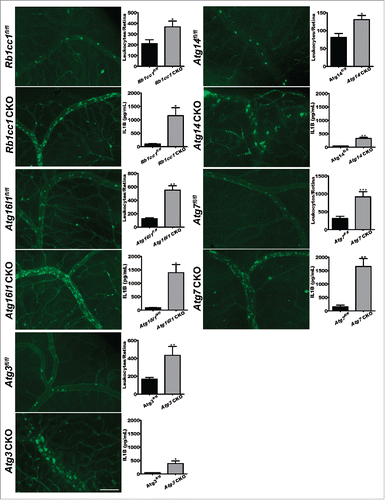
Figure 4. Assessment of uveitis in a murine model of Crohn disease. (A) Representative images of concavalin A lectin perfused retinal whole mount images from mice with genetic knock-in of the Crohn-associated variant ATG16L1T300A (n = 18) versus Atg16l1 WT controls (n = 14). Scale bar: 100 µm. (B) Corresponding quantification of retinal leukostasis. (C) Serum IL1B levels from Atg16l1T300A (n = 3) vs. Atg16l1 WT controls (n = 3). All data are represented as mean ± SEM. Student t test *, P < 0.05; **, P < 0.01.
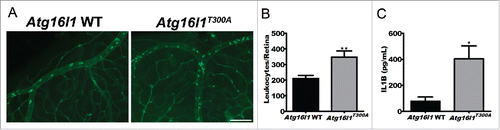
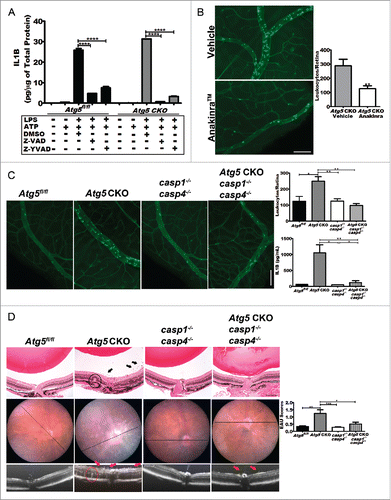
Figure 5. Blocking IL1B reverses severe uveitis. (A) The level of IL1B secreted by Atg5 CKO and floxed control peritoneal macrophages in response to LPS treatment can be reduced in both knockouts and controls by treatment with the pancaspase inhibitor, Z-VAD-FMK or CASP1and CASP4 inhibitor Z -YVAD-FMK. Two-way ANOVA (confidence level=95%) with the Bonferroni post-hoc test ****, P < 0.0001. (B) Pharmacological IL1B inhibition in Atg5 CKO mice using the IL1R (interleukin 1 receptor) antagonist Anakinra™. Representative retinal whole mounts from FITC-concavalin A lectin-perfused vehicle (n = 11) and Anakinra™ (n = 12) treated mice and quantification of adhered leukocytes per retina. Scale bar: 100 µm. Student t test **, P < 0.01 (C) Images of concavalin A lectin-perfused retinal wholemounts from control (Atg5fl/fl) (n = 6), Atg5 CKO (n = 15), casp1−/− casp4−/− knockout (n = 7) or Atg5 CKO casp1 casp4 triple-KO mice (n = 8) and quantification of adhered leukocytes in the retinal vasculature and IL1B serum levels from each group. (D). Representative histology from Atg5fl/fl control (n = 10), or Atg5 CKO (n = 14), casp1−/− casp4−/− double knockout (n = 14), and Atg5 CKO casp1−/− casp4−/− triple knockout mice (n = 14) treated with 200 ug RBP31-20 to induce EAU (top; scale bar: 200 µm) with corresponding fundus and OCT imaging, and EAU grading. Arrows indicate clusters of inflammatory cells in the vitreous and the circled areas highlight a region of retinal abnormality observed across imaging modalities. Kruskal-Wallis test with the Dunn post-hoc test *, P < 0.05; **, P < 0.01; ***, P < 0.001. All data are represented as mean ± SEM.