6,519
Views
102
CrossRef citations to date
0
Altmetric
Basic Research Papers

SQSTM1/p62 mediates crosstalk between autophagy and the UPS in DNA repair

, , , , , , , , , , , , , , , & show all
Pages 1917-1930 | Received 09 Sep 2015, Accepted 27 Jun 2016, Published online: 23 Aug 2016

Figures & data

Figure 1. Nuclear SQSTM1 colocalizes with DDF. (A-D) The colocalization of SQSTM1 and TP53BP1 was analyzed in human fibroblasts (MRC5) exposed to irradiation (IR) for 0 and 5 h in the absence or presence of leptomycin B (Lepto B) as indicated. Representative images are shown in (A) and the mean number of SQSTM1 (B), TP53BP1 (C) and SQSTM1-TP53BP1 colocalization (D) foci were quantified. (E) Representative images of hepatocytes from young (3-m–old) and old (24-mo-old) male C57BL/6 wild-type mice maintained under ad libitum (AL) diet. Sections were immunostained with antibodies against SQSTM1 and γH2AFX. The mean number of SQSTM1 (F), γH2AFX (G) and SQSTM1-γH2AFX colocalization (D) foci were quantified in hepatocyte sections from mice maintained under AL or dietary-restricted (DR) diets. Scale bars: 10 µm; n = 3; error bars represent SEM; *, p < 0.05; **, p < 0.01; ***, p < 0.001.
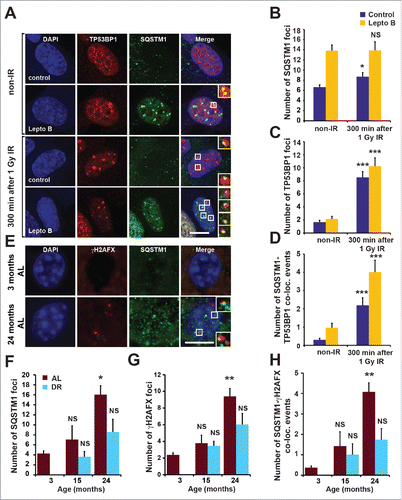
Figure 1. Nuclear SQSTM1 colocalizes with DDF. (A-D) The colocalization of SQSTM1 and TP53BP1 was analyzed in human fibroblasts (MRC5) exposed to irradiation (IR) for 0 and 5 h in the absence or presence of leptomycin B (Lepto B) as indicated. Representative images are shown in (A) and the mean number of SQSTM1 (B), TP53BP1 (C) and SQSTM1-TP53BP1 colocalization (D) foci were quantified. (E) Representative images of hepatocytes from young (3-m–old) and old (24-mo-old) male C57BL/6 wild-type mice maintained under ad libitum (AL) diet. Sections were immunostained with antibodies against SQSTM1 and γH2AFX. The mean number of SQSTM1 (F), γH2AFX (G) and SQSTM1-γH2AFX colocalization (D) foci were quantified in hepatocyte sections from mice maintained under AL or dietary-restricted (DR) diets. Scale bars: 10 µm; n = 3; error bars represent SEM; *, p < 0.05; **, p < 0.01; ***, p < 0.001.

Figure 2. SQSTM1 suppresses resolution of TP53BP1-positive DDF. Representative images (A) and quantification (B) of the mean number of γH2AFX foci in sqstm1−/− and Sqstm1+/+ MEFs in non-IR and 5 and 300 min following 1 Gy X-ray irradiation. (C-D) sqstm1−/− and Sqstm1+/+ MEFs stably expressing mCherry-TP53BP1 were exposed to 0.25 Gy X-ray irradiation and TP53BP1 foci kinetics were monitored by live cell imaging for 300 min. Representative images are shown in (C), the nucleus is marked by a dotted white border. (D) Kaplan-Meier plot showing the survival of individual TP53BP1 foci in sqstm1−/− and Sqstm1+/+ MEFs following irradiation. Note that 0.25 Gy was used to induce a low frequency of DDF and facilitate accurate tracking of foci in vivo. Gehan-Breslow test p<0.01. (E) Quantification of the mean number of endogenous TP53BP1 foci in sqstm1−/− and Sqstm1+/+ MEFs 0-480 min following 1 Gy X-ray irradiation. (F) Quantification of the mean number of endogenous TP53BP1 foci in sqstm1−/− and Sqstm1+/+ MEFs following the induction of DNA damage with etoposide (Etop) for 120 min followed either with or without a 300-min recovery period (in the absence of etoposide). (G) Quantification of the mean number of TP53BP1 foci 300 min after irradiation of sqstm1−/− and Sqstm1+/+ MEFs transfected overnight with control (GFP) or GFP-SQSTM1 plasmids. (H) Sqstm1+/+ MEFs, sqstm1−/− MEFs, and sqstm1−/− MEFs overexpressing FLAG-SQSTM1 were treated with etoposide for 120 min either with or without a 300-min recovery period where indicated. Samples were subjected to neutral comet and the percent tail intensity quantified. (I) Schematic representation of the domain structure of SQSTM1 constructs. Key structural domains are marked: UBA, ubiquitin-associated domain; PB1, Phox and Bem1p domain; ZnF, ZZ type zinc finger domain; NES, nuclear export signal; NLS1/2, nuclear localization signal. (J) Quantification of the mean number of TP53BP1 foci in sqstm1−/− MEFs overexpressing the indicated GFP-tagged SQSTM1 mutants 300 min after irradiation. Scale bar: 10 µm. n = 3; error bars represent SEM; NS, not significant; *, p < 0.05; **, p < 0.01; ***, p < 0.001.
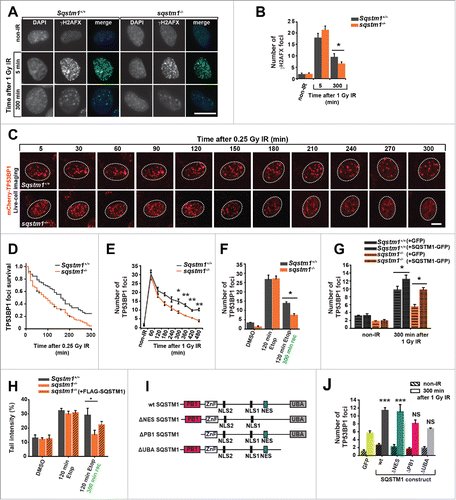
Figure 2. SQSTM1 suppresses resolution of TP53BP1-positive DDF. Representative images (A) and quantification (B) of the mean number of γH2AFX foci in sqstm1−/− and Sqstm1+/+ MEFs in non-IR and 5 and 300 min following 1 Gy X-ray irradiation. (C-D) sqstm1−/− and Sqstm1+/+ MEFs stably expressing mCherry-TP53BP1 were exposed to 0.25 Gy X-ray irradiation and TP53BP1 foci kinetics were monitored by live cell imaging for 300 min. Representative images are shown in (C), the nucleus is marked by a dotted white border. (D) Kaplan-Meier plot showing the survival of individual TP53BP1 foci in sqstm1−/− and Sqstm1+/+ MEFs following irradiation. Note that 0.25 Gy was used to induce a low frequency of DDF and facilitate accurate tracking of foci in vivo. Gehan-Breslow test p<0.01. (E) Quantification of the mean number of endogenous TP53BP1 foci in sqstm1−/− and Sqstm1+/+ MEFs 0-480 min following 1 Gy X-ray irradiation. (F) Quantification of the mean number of endogenous TP53BP1 foci in sqstm1−/− and Sqstm1+/+ MEFs following the induction of DNA damage with etoposide (Etop) for 120 min followed either with or without a 300-min recovery period (in the absence of etoposide). (G) Quantification of the mean number of TP53BP1 foci 300 min after irradiation of sqstm1−/− and Sqstm1+/+ MEFs transfected overnight with control (GFP) or GFP-SQSTM1 plasmids. (H) Sqstm1+/+ MEFs, sqstm1−/− MEFs, and sqstm1−/− MEFs overexpressing FLAG-SQSTM1 were treated with etoposide for 120 min either with or without a 300-min recovery period where indicated. Samples were subjected to neutral comet and the percent tail intensity quantified. (I) Schematic representation of the domain structure of SQSTM1 constructs. Key structural domains are marked: UBA, ubiquitin-associated domain; PB1, Phox and Bem1p domain; ZnF, ZZ type zinc finger domain; NES, nuclear export signal; NLS1/2, nuclear localization signal. (J) Quantification of the mean number of TP53BP1 foci in sqstm1−/− MEFs overexpressing the indicated GFP-tagged SQSTM1 mutants 300 min after irradiation. Scale bar: 10 µm. n = 3; error bars represent SEM; NS, not significant; *, p < 0.05; **, p < 0.01; ***, p < 0.001.

Figure 3. SQSTM1 mediates the effect of autophagy on DNA repair. Representative images (A) and quantification (B) of the mean number of TP53BP1 foci in Atg5+/+ and atg5−/− MEFs 0-480 min after irradiation. (C) Blot showing scrambled control (Sc) and Sqstm1 siRNA in Atg5+/+ and atg5−/− MEFs. (D) Quantification of the mean number of endogenous TP53BP1 foci in Atg5+/+ and atg5−/− MEFs treated with control or Sqstm1 siRNA 5 and 300 min after irradiation. (E) Quantification of the mean number of endogenous TP53BP1 foci in Sqstm1+/+ and sqstm1−/− MEFs treated with or without bafilomycin A1 (Baf) 5 and 300 min after irradiation. Scale bar: 10 µm; n = 3; error bars represent SEM; NS, not significant; *, p < 0.05; **, p < 0.01; ***, p < 0.001.
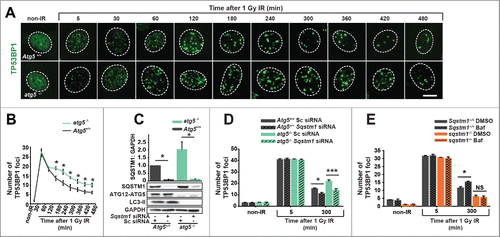
Figure 3. SQSTM1 mediates the effect of autophagy on DNA repair. Representative images (A) and quantification (B) of the mean number of TP53BP1 foci in Atg5+/+ and atg5−/− MEFs 0-480 min after irradiation. (C) Blot showing scrambled control (Sc) and Sqstm1 siRNA in Atg5+/+ and atg5−/− MEFs. (D) Quantification of the mean number of endogenous TP53BP1 foci in Atg5+/+ and atg5−/− MEFs treated with control or Sqstm1 siRNA 5 and 300 min after irradiation. (E) Quantification of the mean number of endogenous TP53BP1 foci in Sqstm1+/+ and sqstm1−/− MEFs treated with or without bafilomycin A1 (Baf) 5 and 300 min after irradiation. Scale bar: 10 µm; n = 3; error bars represent SEM; NS, not significant; *, p < 0.05; **, p < 0.01; ***, p < 0.001.

Figure 4. SQSTM1-dependent proteasomal degradation of FLNA and RAD51 regulates DNA repair. (A) sqstm1−/− MEFs, stably expressing FLAG-SQSTM1 (sqstm1−/−+FLAG-SQSTM1) were irradiated where indicated and 60 min later nuclear fractions were subjected to anti-FLAG IP. The interaction of FLAG-SQSTM1 with endogenous FLNA and RAD51 was detected by immunoblotting. (B) HeLa cells transfected with GFP-FLNA were irradiated, where indicated, and 60 min later nuclear fractions were subjected to anti-GFP IP. The interaction of GFP-FLNA with endogenous SQSTM1 and RAD51 was detected by immunoblotting. (C-D) sqstm1−/− and Sqstm1−/−+FLAG-SQSTM1 MEFs were irradiated and subjected to cellular fractionation at the time points indicated. Nuclear (C) and cytoplasmic (D) fractions were analyzed for FLNA, RAD51, SSQTM1 and LMNB1 as a loading control. Quantification of blots can be found in Fig. S4B-C. (E-G) sqstm1−/− and sqstm1−/−+FLAG-SQSTM1 MEFs were pre-incubated with MG132 or leptomycin B (Lepto B) for 3 h where indicated. Cells were irradiated with 1 Gy X-ray irradiation and incubated in the presence of MG132 or leptomycin B for a further 60 min. Nuclear fractions were analyzed for FLNA ((E)and F) and RAD51 ((E)and G) levels and quantified relative to LMNB1. n = 3; error bars represent SEM; NS, not significant; *, p < 0.05; **, p < 0.01; ***, p < 0.001.
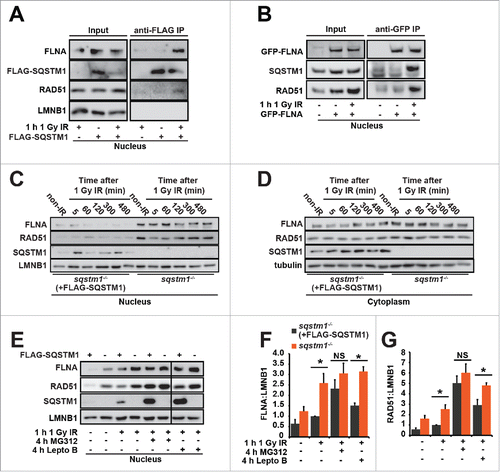
Figure 4. SQSTM1-dependent proteasomal degradation of FLNA and RAD51 regulates DNA repair. (A) sqstm1−/− MEFs, stably expressing FLAG-SQSTM1 (sqstm1−/−+FLAG-SQSTM1) were irradiated where indicated and 60 min later nuclear fractions were subjected to anti-FLAG IP. The interaction of FLAG-SQSTM1 with endogenous FLNA and RAD51 was detected by immunoblotting. (B) HeLa cells transfected with GFP-FLNA were irradiated, where indicated, and 60 min later nuclear fractions were subjected to anti-GFP IP. The interaction of GFP-FLNA with endogenous SQSTM1 and RAD51 was detected by immunoblotting. (C-D) sqstm1−/− and Sqstm1−/−+FLAG-SQSTM1 MEFs were irradiated and subjected to cellular fractionation at the time points indicated. Nuclear (C) and cytoplasmic (D) fractions were analyzed for FLNA, RAD51, SSQTM1 and LMNB1 as a loading control. Quantification of blots can be found in Fig. S4B-C. (E-G) sqstm1−/− and sqstm1−/−+FLAG-SQSTM1 MEFs were pre-incubated with MG132 or leptomycin B (Lepto B) for 3 h where indicated. Cells were irradiated with 1 Gy X-ray irradiation and incubated in the presence of MG132 or leptomycin B for a further 60 min. Nuclear fractions were analyzed for FLNA ((E)and F) and RAD51 ((E)and G) levels and quantified relative to LMNB1. n = 3; error bars represent SEM; NS, not significant; *, p < 0.05; **, p < 0.01; ***, p < 0.001.

Figure 5. FLNA-dependent effect of SQSTM1 on DNA repair. (A) A representative blot of Flna siRNA in sqstm1−/− and sqstm1−/−+FLAG-SQSTM1 MEFs. (B-C) Quantification of the mean number of RAD51 (p<0.05 at 60 and 120 min when comparing sqstm1−/− Sc siRNA to all other conditions) (B) and TP53BP1 (C) foci at the indicated times following irradiation in sqstm1−/− and sqstm1−/−+FLAG-SQSTM1 MEFs treated with control or Flna siRNA. (D) Schematic illustration of the HR and NHEJ reporter systems. A GFP gene containing a killer intron and I-SceI recognition site integrated into normal human skin fibroblast cells. Upon I-SceI transfection, a DSB is produced that can be repaired by NHEJ or HR leading to production of active GFP. (E) Human skin fibroblasts with integrated HR reporter were transfected with I-SceI plasmid along with the indicated siRNA and analyzed 2 d later by flow cytometry. Quantification of the percentage of GFP vs DsRed is shown. (F) Human skin fibroblasts with integrated NHEJ reporter were transfected with I-SceI plasmid along with the indicated siRNA and analyzed 2 d later by flow cytometry. Quantification of the percentage of GFP vs DsRed is shown. n = 3; error bars represent SEM; NS, not significant; *, p < 0.05; **, p < 0.01; ***, p < 0.001.
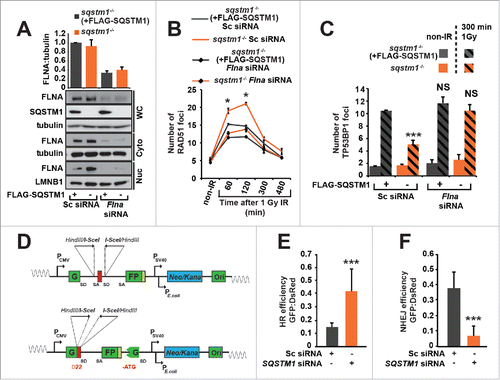
Figure 5. FLNA-dependent effect of SQSTM1 on DNA repair. (A) A representative blot of Flna siRNA in sqstm1−/− and sqstm1−/−+FLAG-SQSTM1 MEFs. (B-C) Quantification of the mean number of RAD51 (p<0.05 at 60 and 120 min when comparing sqstm1−/− Sc siRNA to all other conditions) (B) and TP53BP1 (C) foci at the indicated times following irradiation in sqstm1−/− and sqstm1−/−+FLAG-SQSTM1 MEFs treated with control or Flna siRNA. (D) Schematic illustration of the HR and NHEJ reporter systems. A GFP gene containing a killer intron and I-SceI recognition site integrated into normal human skin fibroblast cells. Upon I-SceI transfection, a DSB is produced that can be repaired by NHEJ or HR leading to production of active GFP. (E) Human skin fibroblasts with integrated HR reporter were transfected with I-SceI plasmid along with the indicated siRNA and analyzed 2 d later by flow cytometry. Quantification of the percentage of GFP vs DsRed is shown. (F) Human skin fibroblasts with integrated NHEJ reporter were transfected with I-SceI plasmid along with the indicated siRNA and analyzed 2 d later by flow cytometry. Quantification of the percentage of GFP vs DsRed is shown. n = 3; error bars represent SEM; NS, not significant; *, p < 0.05; **, p < 0.01; ***, p < 0.001.

Figure 6. Diagrammatic representation of the role of SQSTM1 in DDR. Following DNA damage, FLNA provides a scaffold to support recruitment of RAD51 and promote DNA repair. We have demonstrated that SQSTM1 can interact with and facilitate the proteasomal degradation of FLNA following DNA damage (induced herein by X-ray irradiation). High levels of nuclear SQSTM1 increased degradation of FLNA, which negatively affected RAD51 recruitment to the sites of DNA damage and therefore increased the amount of time required for DNA damage to be fully resolved. These results have important implications for aging as SQSTM1 levels are carefully regulated by its own turnover via autophagy and proteasomal degradation; perturbation of both have been demonstrated in aging models. Changes in nuclear levels of SQSTM1 could directly contribute to defects in the DDR, further compounding aging-related pathologies. Inverse correlations between autophagy and SQSTM1, nuclear levels of FLNA and SQSTM1 as well as RAD51 and DNA damage are illustrated by the chart.
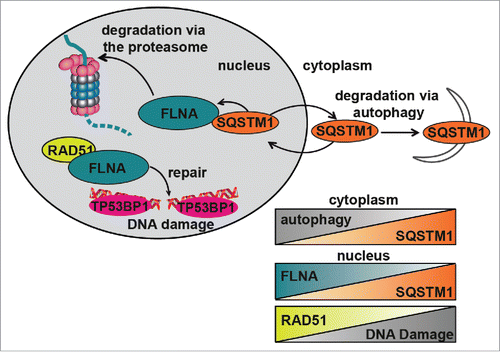
Figure 6. Diagrammatic representation of the role of SQSTM1 in DDR. Following DNA damage, FLNA provides a scaffold to support recruitment of RAD51 and promote DNA repair. We have demonstrated that SQSTM1 can interact with and facilitate the proteasomal degradation of FLNA following DNA damage (induced herein by X-ray irradiation). High levels of nuclear SQSTM1 increased degradation of FLNA, which negatively affected RAD51 recruitment to the sites of DNA damage and therefore increased the amount of time required for DNA damage to be fully resolved. These results have important implications for aging as SQSTM1 levels are carefully regulated by its own turnover via autophagy and proteasomal degradation; perturbation of both have been demonstrated in aging models. Changes in nuclear levels of SQSTM1 could directly contribute to defects in the DDR, further compounding aging-related pathologies. Inverse correlations between autophagy and SQSTM1, nuclear levels of FLNA and SQSTM1 as well as RAD51 and DNA damage are illustrated by the chart.
Supplemental material

1210368_Supplemental_Material.zip

Download Zip (32.5 MB)