3,869
Views
75
CrossRef citations to date
0
Altmetric
Basic Research Papers

Transcriptional regulation of core autophagy and lysosomal genes by the androgen receptor promotes prostate cancer progression

, , , , , , , , , , , , , & show all
Pages 506-521 | Received 21 Jan 2016, Accepted 30 Nov 2016, Published online: 13 Jan 2017

Figures & data

Figure 1. Androgens increase the expression of a subset of core autophagy genes in prostate cancer. (A) LNCaP and VCaP cells were treated with vehicle (ethanol) or 2 different concentrations (100 pM or 10 nM) of the synthetic androgen R1881 for 24 or 72 h. Cells were then harvested and assayed for mRNA levels using a curated qPCR-based array of core autophagy genes and normalized to RPLP0 mRNA levels. Duplicate samples for each condition are shown. (B) Validation (qPCR) in biological triplicate of results shown in (A) confirming the androgen induction of ATG4B, ATG4D, ULK1 and ULK2. *, significant (P < 0.05) changes from vehicle. (C) Four genes (ATG4B, ATG4D, ULK1 and ULK2) were confirmed with western blot. Cells were treated with increasing concentrations of R1881 (LNCaP: 0, 0.1, 1 and 10 nM shown; VCaP: 0, 0.1 and 10 nM shown). A summary of these data with the full dose response (0, 0.1, 1 and 10 nM) and statistical analyses of the experimental repeats is presented in Table S1. (D) A gene signature of the 4 autophagy genes (ATG4B, ATG4D, ULK1, ULK2) correlated significantly with a previously described AR gene signatureCitation23 in prostate cancer patients from the Taylor et alCitation24 clinical cohort. Similar results were obtained using additional AR activity signatures across multiple clinical cohorts.
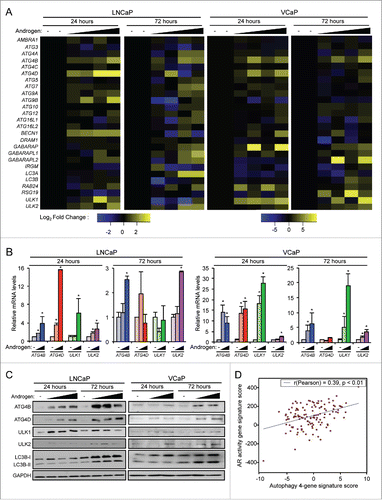
Figure 1. Androgens increase the expression of a subset of core autophagy genes in prostate cancer. (A) LNCaP and VCaP cells were treated with vehicle (ethanol) or 2 different concentrations (100 pM or 10 nM) of the synthetic androgen R1881 for 24 or 72 h. Cells were then harvested and assayed for mRNA levels using a curated qPCR-based array of core autophagy genes and normalized to RPLP0 mRNA levels. Duplicate samples for each condition are shown. (B) Validation (qPCR) in biological triplicate of results shown in (A) confirming the androgen induction of ATG4B, ATG4D, ULK1 and ULK2. *, significant (P < 0.05) changes from vehicle. (C) Four genes (ATG4B, ATG4D, ULK1 and ULK2) were confirmed with western blot. Cells were treated with increasing concentrations of R1881 (LNCaP: 0, 0.1, 1 and 10 nM shown; VCaP: 0, 0.1 and 10 nM shown). A summary of these data with the full dose response (0, 0.1, 1 and 10 nM) and statistical analyses of the experimental repeats is presented in Table S1. (D) A gene signature of the 4 autophagy genes (ATG4B, ATG4D, ULK1, ULK2) correlated significantly with a previously described AR gene signatureCitation23 in prostate cancer patients from the Taylor et alCitation24 clinical cohort. Similar results were obtained using additional AR activity signatures across multiple clinical cohorts.

Figure 2. ATG4B, ATG4D, ULK1, and ULK2 are transcriptional targets of AR. (A) LNCaP cells were treated with vehicle (ethanol) or androgen (100 pM R1881) for the indicated times before RNA was collected and subjected to qPCR. Data are normalized to RPLP0 and expressed as mean fold induction ± SE. *, significant (P < 0.05) changes from vehicle. (B) LNCaP cells were treated for 8 h with vehicle or androgen ± 1 μg/ml actinomycin D. FKBP5 is a known transcriptional target of AR.Citation25 Data are normalized to RPLP0 and expressed as mean fold induction + SE. *, significant (P < 0.05) changes from vehicle. (C) LNCaP cells were treated for 16 h with vehicle or androgen (100 pM R1881) ± 1 μg/μl cycloheximide. FKBP5 is a direct transcriptional target of AR, CXCR4 is an indirect transcriptional target of AR.Citation25 Data are normalized to RPLP0 and expressed as mean fold induction + SE. *, significant (P < 0.05) changes from vehicle. (D) ChIP-Seq tracks of LNCaP cells treated with vehicle or DHT for 2 h. AR binding sites in the intronic regions of ULK1 and ULK2 are highlighted. Similar data for VCaP and C4–2B cells are presented in Fig. S1. (E) Various enhancer luciferase reporter constructs including those containing the potential AR binding sites identified in (D) were transfected into LNCaP cells and treated overnight with an androgen (R1881) dose response (0, 0.1, 1, and 10 nM). After treatment, cells were harvested and assayed for luciferase activity. Luciferase values were normalized to the β-galactosidase control. Data are the mean relative light units (RLUs) + SEM for one representative experiment conducted in triplicate (n = 3). *, significant (P < 0.05) changes from vehicle-treated cells.
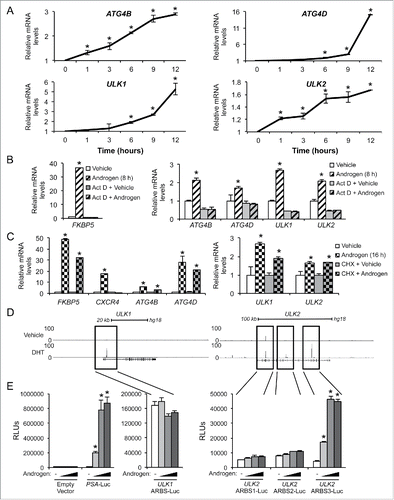
Figure 2. ATG4B, ATG4D, ULK1, and ULK2 are transcriptional targets of AR. (A) LNCaP cells were treated with vehicle (ethanol) or androgen (100 pM R1881) for the indicated times before RNA was collected and subjected to qPCR. Data are normalized to RPLP0 and expressed as mean fold induction ± SE. *, significant (P < 0.05) changes from vehicle. (B) LNCaP cells were treated for 8 h with vehicle or androgen ± 1 μg/ml actinomycin D. FKBP5 is a known transcriptional target of AR.Citation25 Data are normalized to RPLP0 and expressed as mean fold induction + SE. *, significant (P < 0.05) changes from vehicle. (C) LNCaP cells were treated for 16 h with vehicle or androgen (100 pM R1881) ± 1 μg/μl cycloheximide. FKBP5 is a direct transcriptional target of AR, CXCR4 is an indirect transcriptional target of AR.Citation25 Data are normalized to RPLP0 and expressed as mean fold induction + SE. *, significant (P < 0.05) changes from vehicle. (D) ChIP-Seq tracks of LNCaP cells treated with vehicle or DHT for 2 h. AR binding sites in the intronic regions of ULK1 and ULK2 are highlighted. Similar data for VCaP and C4–2B cells are presented in Fig. S1. (E) Various enhancer luciferase reporter constructs including those containing the potential AR binding sites identified in (D) were transfected into LNCaP cells and treated overnight with an androgen (R1881) dose response (0, 0.1, 1, and 10 nM). After treatment, cells were harvested and assayed for luciferase activity. Luciferase values were normalized to the β-galactosidase control. Data are the mean relative light units (RLUs) + SEM for one representative experiment conducted in triplicate (n = 3). *, significant (P < 0.05) changes from vehicle-treated cells.

Figure 3. ATG4B, ATG4D, ULK1, and ULK2 are necessary for maximal androgen-mediated autophagy and proliferation. (A) LNCaP cells were transfected with siRNAs and then treated with vehicle (ethanol) or androgen (R1881) for 72 h before cells were harvested and cell lysates were subjected to immunoblot analysis. Densitometry results for these data with statistical analyses from experimental repeats are presented in Fig. S2. (B) LNCaP cells were transfected with siRNAs as in (A) except this time siRNAs were pooled to maximize knockdowns. Cells were then treated with vehicle (ethanol) or androgen (R1881) ± 20 μM chloroquine for 72 h and then subjected to immunoblot analysis as in (A). Densitometry results for these data with statistical analyses from experimental repeats are presented in Table S2. (C) LNCaP cells stably expressing eGFP-LC3B were transfected with siRNAs and then treated with vehicle (ethanol) or androgen (R1881) for 72 h before cells were fixed and stained with DAPI. Experiments were performed in triplicate and 10 random images from each treatment group were taken. One representative image of each is shown. Quantification of eGFP-LC3B puncta/nuclei is shown in the graph on the right. *, significant (P < 0.05) changes from vehicle-treated cells. #, significant (P < 0.05) changes from siControl-transfected cells. (D) LNCaP cells were transfected with siControl or siRNAs directed against ATG4B and ATG4D or ULK1 and ULK2. Transfected cells were then treated with vehicle or androgen (R1881) for 7 d. Cells were then lysed, and the relative number of cells was quantified using a fluorescent DNA-binding dye. Results are expressed as mean relative fold induction + SE. *, significant (P < 0.05) changes from siControl + vehicle. (E) LNCaP cells were transfected as in (D) and treated with vehicle, androgen (R1881) or paclitaxel (positive control) for 72 h. Cells were then subjected to PI staining and subsequent FACS analysis to assess sub G0/G1 DNA levels. #, significant (P < 0.05) changes from siControl-transfected cells. No significant androgen-mediated effects were observed. (F) LNCaP cells were transfected and treated as in (E). Cells were then subjected to PI staining and FACS analysis to assess S phase DNA levels. *, significant (P < 0.05) changes from vehicle-treated cells. #, significant (P < 0.05) changes from siControl-transfected cells. (G) Untreated LNCaP cells were transfected with mock or the indicated mammalian expression vectors for 3 d. Cells were then lysed and subjected to western blot analysis to confirm overexpression (Fig. S5) or the relative number of cells was quantified as in (E). *, significant (P < 0.05) changes from empty vector (Control). (H) Hormone-sensitive LNCaP and CWR22 cells, and their respective CRPC derivatives, C4–2 and 22Rv1, were probed for basal ATG4B, ATG4D, ULK1, ULK2 and LC3B protein levels. (I) The AR-regulated autophagy gene signature of ATG4B, ATG4D, ULK1 and ULK2 was subjected to Kaplan-Meier analysis using clinical data from The Cancer Genome Atlas (TCGA).Citation63
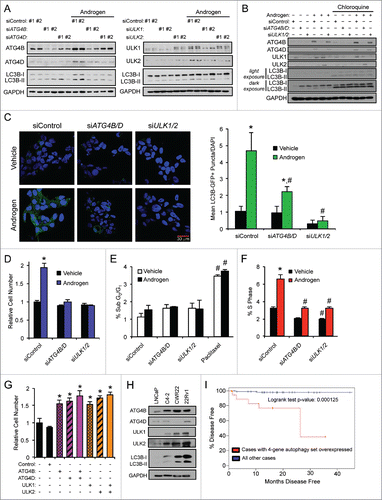
Figure 3. ATG4B, ATG4D, ULK1, and ULK2 are necessary for maximal androgen-mediated autophagy and proliferation. (A) LNCaP cells were transfected with siRNAs and then treated with vehicle (ethanol) or androgen (R1881) for 72 h before cells were harvested and cell lysates were subjected to immunoblot analysis. Densitometry results for these data with statistical analyses from experimental repeats are presented in Fig. S2. (B) LNCaP cells were transfected with siRNAs as in (A) except this time siRNAs were pooled to maximize knockdowns. Cells were then treated with vehicle (ethanol) or androgen (R1881) ± 20 μM chloroquine for 72 h and then subjected to immunoblot analysis as in (A). Densitometry results for these data with statistical analyses from experimental repeats are presented in Table S2. (C) LNCaP cells stably expressing eGFP-LC3B were transfected with siRNAs and then treated with vehicle (ethanol) or androgen (R1881) for 72 h before cells were fixed and stained with DAPI. Experiments were performed in triplicate and 10 random images from each treatment group were taken. One representative image of each is shown. Quantification of eGFP-LC3B puncta/nuclei is shown in the graph on the right. *, significant (P < 0.05) changes from vehicle-treated cells. #, significant (P < 0.05) changes from siControl-transfected cells. (D) LNCaP cells were transfected with siControl or siRNAs directed against ATG4B and ATG4D or ULK1 and ULK2. Transfected cells were then treated with vehicle or androgen (R1881) for 7 d. Cells were then lysed, and the relative number of cells was quantified using a fluorescent DNA-binding dye. Results are expressed as mean relative fold induction + SE. *, significant (P < 0.05) changes from siControl + vehicle. (E) LNCaP cells were transfected as in (D) and treated with vehicle, androgen (R1881) or paclitaxel (positive control) for 72 h. Cells were then subjected to PI staining and subsequent FACS analysis to assess sub G0/G1 DNA levels. #, significant (P < 0.05) changes from siControl-transfected cells. No significant androgen-mediated effects were observed. (F) LNCaP cells were transfected and treated as in (E). Cells were then subjected to PI staining and FACS analysis to assess S phase DNA levels. *, significant (P < 0.05) changes from vehicle-treated cells. #, significant (P < 0.05) changes from siControl-transfected cells. (G) Untreated LNCaP cells were transfected with mock or the indicated mammalian expression vectors for 3 d. Cells were then lysed and subjected to western blot analysis to confirm overexpression (Fig. S5) or the relative number of cells was quantified as in (E). *, significant (P < 0.05) changes from empty vector (Control). (H) Hormone-sensitive LNCaP and CWR22 cells, and their respective CRPC derivatives, C4–2 and 22Rv1, were probed for basal ATG4B, ATG4D, ULK1, ULK2 and LC3B protein levels. (I) The AR-regulated autophagy gene signature of ATG4B, ATG4D, ULK1 and ULK2 was subjected to Kaplan-Meier analysis using clinical data from The Cancer Genome Atlas (TCGA).Citation63

Figure 4. AR stimulates TFEB expression and activity. (A) LNCaP cells treated with vehicle (ethanol) or androgen (100 pM or 10 nM R1881) for 24 or 72 h and then subjected to qPCR analysis. (B) LNCaP cells treated for 24 h with an androgen dose response (0, 0.1, 1 or 10 nM R1881) and then subjected to immunoblot analysis. Left, representative images. Right, densitometry (n = 3). *, significant (P < 0.05) changes from vehicle. (C) C4–2, a castration-resistant prostate cancer (CRPC) cell line-derivative of LNCaPs, were transfected with siRNAs targeting AR or control, lysed and probed for TFEB. (D) ChIP-Seq tracks of LNCaP cells treated with vehicle or DHT 2 h. AR binding sites in the intronic region and direct upstream region of TFEB are highlighted. Similar data for VCaP and C4–2B cells are presented in Fig. S7. (E) LNCaP cells were treated with vehicle or androgen (R1881) ± 1 μg/μl cycloheximide and subjected to qPCR analysis as in . FKBP5 is a known direct transcriptional target of AR, while CXCR4 is a known indirect AR transcriptional target.Citation25 Data are normalized to RPLP0 and expressed as mean fold induction ± SE. *, significant (P < 0.05) changes from vehicle. (F) Various enhancer luciferase reporter constructs including those containing the potential AR binding sites identified in (D) were transfected into LNCaP cells and treated overnight with an androgen (R1881) dose response (0, 0.1, 1, and 10 nM). After treatment, cells were harvested and assayed for luciferase activity. Luciferase values were normalized to β-galactosidase control. Data are the mean relative light units (RLUs) + SEM for one representative experiment conducted in triplicate (n = 3). *, significant (P < 0.05) changes from vehicle-treated cells. (G) Hormone-sensitive LNCaP and CWR22 cells, and their respective CRPC derivatives, C4–2 and 22Rv1, were probed for basal TFEB protein levels. (H) LNCaP cells were transfected with a KLK3/PSA-luciferase reporter plasmid or a 4X-CLEAR (TFEB DNA binding sequence)-luciferase reporter plasmid in conjunction with a CMV-β-galactosidase control plasmid. After transfection, cells were treated with vehicle or increasing concentrations of R1881 for 24 h. Cells were harvested and assayed for luciferase activity. All luciferase values were normalized to β-galactosidase transfection controls. Data are expressed as normalized relative light units (RLUs) ± SE. *, significant (P < 0.05) changes from vehicle. (I) VCaP cells were treated as indicated and subjected to qPCR analysis to quantitate the mRNAs levels of 6 established transcriptional targets of TFEB34,69: ATP6AP1, LAMP1, PPARGC1A, GLB1, MCOLN1, and SQSTM1.
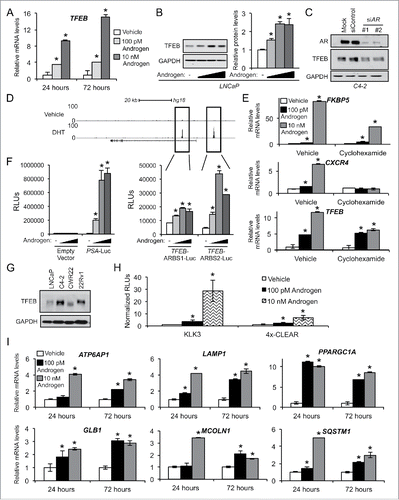
Figure 4. AR stimulates TFEB expression and activity. (A) LNCaP cells treated with vehicle (ethanol) or androgen (100 pM or 10 nM R1881) for 24 or 72 h and then subjected to qPCR analysis. (B) LNCaP cells treated for 24 h with an androgen dose response (0, 0.1, 1 or 10 nM R1881) and then subjected to immunoblot analysis. Left, representative images. Right, densitometry (n = 3). *, significant (P < 0.05) changes from vehicle. (C) C4–2, a castration-resistant prostate cancer (CRPC) cell line-derivative of LNCaPs, were transfected with siRNAs targeting AR or control, lysed and probed for TFEB. (D) ChIP-Seq tracks of LNCaP cells treated with vehicle or DHT 2 h. AR binding sites in the intronic region and direct upstream region of TFEB are highlighted. Similar data for VCaP and C4–2B cells are presented in Fig. S7. (E) LNCaP cells were treated with vehicle or androgen (R1881) ± 1 μg/μl cycloheximide and subjected to qPCR analysis as in Fig. 2C. FKBP5 is a known direct transcriptional target of AR, while CXCR4 is a known indirect AR transcriptional target.Citation25 Data are normalized to RPLP0 and expressed as mean fold induction ± SE. *, significant (P < 0.05) changes from vehicle. (F) Various enhancer luciferase reporter constructs including those containing the potential AR binding sites identified in (D) were transfected into LNCaP cells and treated overnight with an androgen (R1881) dose response (0, 0.1, 1, and 10 nM). After treatment, cells were harvested and assayed for luciferase activity. Luciferase values were normalized to β-galactosidase control. Data are the mean relative light units (RLUs) + SEM for one representative experiment conducted in triplicate (n = 3). *, significant (P < 0.05) changes from vehicle-treated cells. (G) Hormone-sensitive LNCaP and CWR22 cells, and their respective CRPC derivatives, C4–2 and 22Rv1, were probed for basal TFEB protein levels. (H) LNCaP cells were transfected with a KLK3/PSA-luciferase reporter plasmid or a 4X-CLEAR (TFEB DNA binding sequence)-luciferase reporter plasmid in conjunction with a CMV-β-galactosidase control plasmid. After transfection, cells were treated with vehicle or increasing concentrations of R1881 for 24 h. Cells were harvested and assayed for luciferase activity. All luciferase values were normalized to β-galactosidase transfection controls. Data are expressed as normalized relative light units (RLUs) ± SE. *, significant (P < 0.05) changes from vehicle. (I) VCaP cells were treated as indicated and subjected to qPCR analysis to quantitate the mRNAs levels of 6 established transcriptional targets of TFEB34,69: ATP6AP1, LAMP1, PPARGC1A, GLB1, MCOLN1, and SQSTM1.

Figure 5. TFEB is required for maximal androgen-mediated autophagic flux, cell proliferation and lysosomal biogenesis. (A) LNCaP or CRPC C4–2 cells were transfected with siRNAs and then treated with vehicle (ethanol) or androgen (R1881) for 72 h before cells were lysed and subjected to immunoblot analysis. (B) LNCaP cells were transfected and treated as in (A) and then subjected to qPCR analysis. *, significant (P < 0.05) changes from vehicle-treated cells. #, significant (P < 0.05) changes from siControl-transfected cells. (C) LNCaP cells transiently expressing a mCherry-GFP-LC3B construct were transfected with siRNAs and then treated with vehicle or androgen (R1881) for 72 h before cells were fixed, nuclei stained with DAPI (blue) and imaged. Experiments were performed in triplicate and 10 random images from each treatment group were taken. One representative image of each is shown. Quantification of puncta/cell is shown in the graph on the right. *, significant (P < 0.05) changes from vehicle-treated cells. #, significant (P < 0.05) changes from siControl-transfected cells. (D) LNCaP cells were transfected with siRNAs targeting scramble control or TFEB. 24 h post-transfection, cells were treated ± androgen and cultured for 72 h, fixed and then stained with LysoTracker Red (red) and DAPI (blue). Total lysosomal area (red) per image was taken as a fraction of nuclear area (blue) using an ImageJ script. *, significant (P < 0.05) changes from vehicle-treated cells. #, significant (P < 0.05) changes from siControl-transfected cells. (E) LNCaP cells were transfected with siRNAs directed against scramble control or TFEB and then treated with vehicle or androgen (R1881) for 7 d. Relative cell numbers were then quantified as in . Results are expressed as mean relative fold induction + SE. *, significant (P < 0.05) changes. (F) LNCaP cells were transfected as in (E) and treated with vehicle, androgen (R1881) or paclitaxel (positive control) for 72 h. Cells were then subjected to PI staining and subsequent FACS analysis to assess sub G0/G1 DNA levels. #, significant (P < 0.05) changes from siControl-transfected cells. No significant androgen-mediated effects were observed. (G) LNCaP cells were transfected and treated as in (F). Cells were then subjected to PI staining and FACS analysis to assess S phase DNA levels. *, significant (P < 0.05) changes from vehicle-treated cells. #, significant (P < 0.05) changes from siControl-transfected cells. (H) Untreated LNCaP cells were transfected with mock or the indicated mammalian expression vectors for 3 d. Cells were then lysed and subjected to western blot analysis to confirm overexpression (Figs. S5 and S10) or the relative number of cells was quantified as in (E). *, significant (P < 0.05) changes from empty vector (Control).
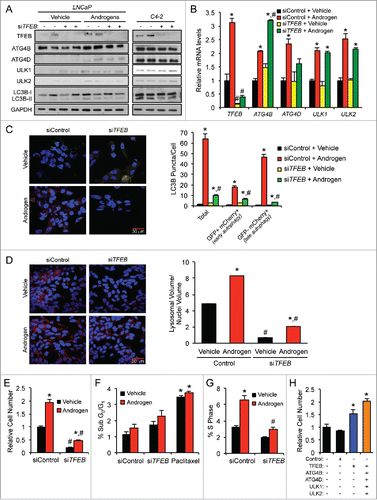
Figure 5. TFEB is required for maximal androgen-mediated autophagic flux, cell proliferation and lysosomal biogenesis. (A) LNCaP or CRPC C4–2 cells were transfected with siRNAs and then treated with vehicle (ethanol) or androgen (R1881) for 72 h before cells were lysed and subjected to immunoblot analysis. (B) LNCaP cells were transfected and treated as in (A) and then subjected to qPCR analysis. *, significant (P < 0.05) changes from vehicle-treated cells. #, significant (P < 0.05) changes from siControl-transfected cells. (C) LNCaP cells transiently expressing a mCherry-GFP-LC3B construct were transfected with siRNAs and then treated with vehicle or androgen (R1881) for 72 h before cells were fixed, nuclei stained with DAPI (blue) and imaged. Experiments were performed in triplicate and 10 random images from each treatment group were taken. One representative image of each is shown. Quantification of puncta/cell is shown in the graph on the right. *, significant (P < 0.05) changes from vehicle-treated cells. #, significant (P < 0.05) changes from siControl-transfected cells. (D) LNCaP cells were transfected with siRNAs targeting scramble control or TFEB. 24 h post-transfection, cells were treated ± androgen and cultured for 72 h, fixed and then stained with LysoTracker Red (red) and DAPI (blue). Total lysosomal area (red) per image was taken as a fraction of nuclear area (blue) using an ImageJ script. *, significant (P < 0.05) changes from vehicle-treated cells. #, significant (P < 0.05) changes from siControl-transfected cells. (E) LNCaP cells were transfected with siRNAs directed against scramble control or TFEB and then treated with vehicle or androgen (R1881) for 7 d. Relative cell numbers were then quantified as in Fig. 3D. Results are expressed as mean relative fold induction + SE. *, significant (P < 0.05) changes. (F) LNCaP cells were transfected as in (E) and treated with vehicle, androgen (R1881) or paclitaxel (positive control) for 72 h. Cells were then subjected to PI staining and subsequent FACS analysis to assess sub G0/G1 DNA levels. #, significant (P < 0.05) changes from siControl-transfected cells. No significant androgen-mediated effects were observed. (G) LNCaP cells were transfected and treated as in (F). Cells were then subjected to PI staining and FACS analysis to assess S phase DNA levels. *, significant (P < 0.05) changes from vehicle-treated cells. #, significant (P < 0.05) changes from siControl-transfected cells. (H) Untreated LNCaP cells were transfected with mock or the indicated mammalian expression vectors for 3 d. Cells were then lysed and subjected to western blot analysis to confirm overexpression (Figs. S5 and S10) or the relative number of cells was quantified as in (E). *, significant (P < 0.05) changes from empty vector (Control).

Table 1. Correlation of AR activity with an autophagy gene signature in patients. The expression of a previously annotated AR activity gene signatureCitation23 was correlated with an autophagy gene signature consisting of ATG4B, ATG4D, ULK1, ULK2 and TFEB in primary cancers and metastatic cancers from the Taylor et al. 201024 prostate cancer clinical data set.

Figure 6. An autophagy gene signature positively correlates with the transition to prostate cancer metastasis, whereas general AR activity gene signatures positively correlate with cancer initiation but not metastatic progression. Bioinformatic analysis of 3 separate prostate cancer clinical cohorts (A-C: Grasso et al., 201240; D-F: Taylor et al., 201024; G-I: Varambally et al., 200541). The expression of 2 previously described AR activity gene signatures (Hieronymus et al., 200623: A, D, G and Nelson et al., 200239: B, E, H) or an autophagy gene signature consisting of ATG4B, ATG4D, ULK1, ULK2 and TFEB were compared between samples from normal prostates, primary cancers and metastatic cancers in each cohort.
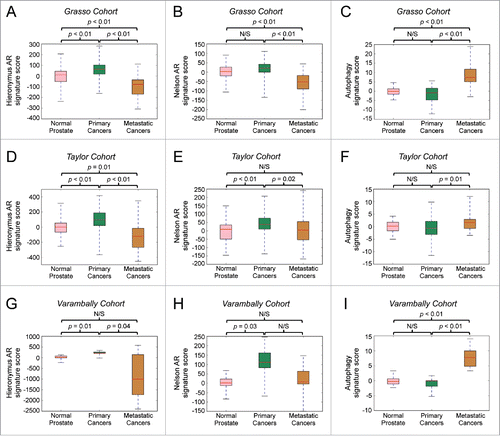
Figure 6. An autophagy gene signature positively correlates with the transition to prostate cancer metastasis, whereas general AR activity gene signatures positively correlate with cancer initiation but not metastatic progression. Bioinformatic analysis of 3 separate prostate cancer clinical cohorts (A-C: Grasso et al., 201240; D-F: Taylor et al., 201024; G-I: Varambally et al., 200541). The expression of 2 previously described AR activity gene signatures (Hieronymus et al., 200623: A, D, G and Nelson et al., 200239: B, E, H) or an autophagy gene signature consisting of ATG4B, ATG4D, ULK1, ULK2 and TFEB were compared between samples from normal prostates, primary cancers and metastatic cancers in each cohort.
Supplemental material

Supplementary files

Download Zip (2.1 MB)

Reprints and Corporate Permissions

Please note: Selecting permissions does not provide access to the full text of the article, please see our help page How do I view content?

To request a reprint or corporate permissions for this article, please click on the relevant link below:

Academic Permissions

Please note: Selecting permissions does not provide access to the full text of the article, please see our help page How do I view content?

Obtain permissions instantly via Rightslink by clicking on the button below:

If you are unable to obtain permissions via Rightslink, please complete and submit this Permissions form. For more information, please visit our Permissions help page.