
Figures & data
Figure 1. Kinetics, cellular trafficking and distribution of BODIPY-CD. (A) Kinetics of BODIPY-CD entering and leaving WT and NPC1 fibroblasts. The images were acquired after incubation with 10 µM BODIPY-CD for the indicated times. (B) Cellular distribution of BODIPY-CD in U2OS cells localized with the RFP-tagged RAB5A (early endosome, EE), RAB7A (late endosome, LE), LAMP1 (lysosome, LY) and LC3B protein (LC3B vesicles, LC3/V). The fluorescence colocalization of BODIPY-CD and RFP were measured at the indicated times after BODIPY-CD was added to the cells. Only colocalized images are displayed and kinetic images are shown in Fig. S1D. Green triangles and *CD: BODIPY-CD. Scale bar: 10 µm.
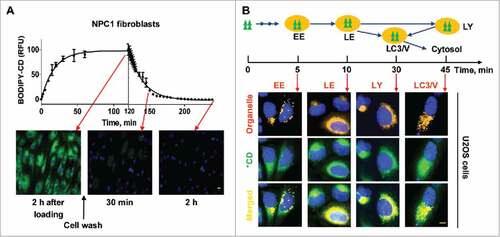
Figure 2. MβCD increases autophagosome formation and restores impaired autophagy flux in NPC1 cells. (A) Autophagy detection in both WT and NPC1 fibroblasts, NSCs and neurons. Cells were treated with the indicated compounds (100 µM MβCD, 100 nM bafilomycin A1 (baf. A1) or MβCD plus baf. A1) for 24 h, followed by western blot analysis. For this and all subsequent figures, a representative western blot is shown, and the bar graph represents the mean ± SEM of at least 3 replicates, unless otherwise noted. The intensity of LC3B-II and SQSTM1 were normalized with GAPDH. (B) Time-courses of LC3B and SQSTM1 levels in NPC1 cells after treatment with 100 µM MβCD. Cells were treated for the indicated times and analyzed by western blot. LC3B-II and SQSTM1 expression were normalized with GAPDH expression. (C) Quantification of LC3B and SQSTM1 immunofluorescence in WT and NPC1 fibroblasts and NSCs displayed in Fig. S2A. The normalized relative fluorescence intensities of LC3B and SQSTM1 dots are shown in bar graphs (mean ± SEM for at least 3 fields). (D) Time courses for effect of MβCD on reduction of cholesterol accumulation in NPC1 fibroblasts, NSCs and neurons. NPC1 cells were cultured in 96-well plates and treated with 100 µM MβCD for the indicated days, followed by the filipin staining assay. Data represent mean ± SEM of 3 replicates. For this and all subsequent figures, * p < 0.05, ** p < 0.01 and *** p < 0.001 compared to control, unless otherwise noted. (E) Images of mRFP-GFP-LC3B tandem sensor in NPC1 fibroblasts. Cells expressing this sensor were treated with the compounds for the indicated times and then stained with Hoechst 33342. GFP signal shows autophagosomes, whereas RFP signal indicates autophagosomes combined with autolysosomes. The number of GFP+ and RFP+ merged punctate structures, as well as the number of non-merged RFP+ punctate structures, were quantified for at least 10 cells. Scale bar: 10 µm. RFU, relative fluorescent units.
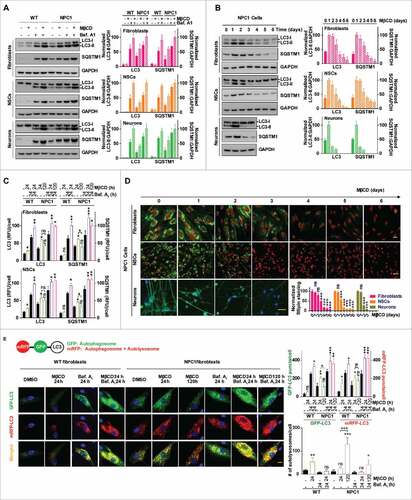
Figure 3. MβCD activates AMPK and the autophagy pathway. (A) Time courses of AMPK activation indicated by an increase in the phosphorylation of Thr172 on PRKAA in NPC1 cells. Indicated cells were treated with 100 µM MβCD for the indicated times, followed by western blot analysis with anti-PRKAA Thr172 antibodies. The ratio of the intensity of phosphorylated PRKAA at Thr172 and total PRKAA is shown. (B) Concentration-dependent activation of AMPK in NPC1 NSCs measured by a TR-FRET assay. The up panel shows the TR-FRET assay to detect the phosphorylation levels of Thr172 on PRKAA using an anti-PRKAA antibody for the nonphosphorylated (i.e., total) portion and an anti-phospho-Thr172 antibody. After cells in 384-well plates were treated with MβCD for 1.5 h, cells were lysed. The TR-FRET assay reagent mixture was added and TR-FRET signals were detected. (C) Correlation of AMPK activation with the activation of downstream proteins (TSC2, ULK1, RPTOR) and inhibition of MTOR in WT and NPC1 cells. Cells were treated with 100 µM MβCD for 1.5 h and lysed followed by western blotting. The ratio of the intensity of phosphorylated protein and total protein is shown.
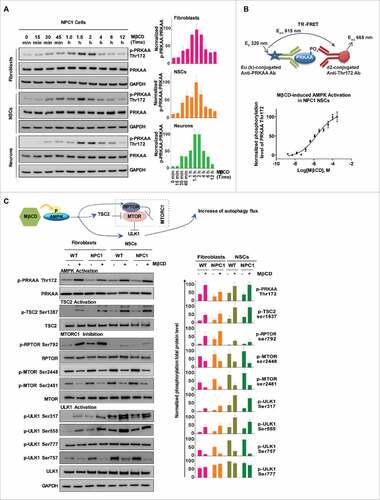
Figure 4. MβCD binds to PRKAB1 and PRKAB2 with a higher affinity for PRKAB1. (A) Temperature melting curves of PRKAB1 and PRKAB2 in the presence or absence of 300 µM MβCD. The relative chemiluminescent intensity of each sample at different temperatures was used to generate temperature-dependent melting curves and the apparent aggregation temperature (Tagg) was calculated by nonlinear regression. (B) Apparent binding affinities of MβCD with PRKAB1 and PRKAB2 measured by CETSA. Cell lysates were treated with MβCD and heated to 53°C for 3 min. The supernatants obtained after centrifugation were analyzed by western blotting using anti-PRKAB1 or anti-PRKAB2 antibody. A representative blot was shown and data represent mean ± SEM of at least 3 replicates. (C) MβCD reduced NPC1 phenotypes in fibroblasts, NSCs and neurons. NPC1 cells were cultured in 96-well plates and treated with various concentrations of MβCD. After a 4-d (fibroblasts and NSCs) or 3-d (neurons) incubation filipin or LysoTracker Red staining was performed. Data represent mean ± SEM of 3 replicates. (D) A structural model of AMPK (PRKAA2B1G1, PDB code 4CFF) bound with MβCD (yellow), activator A769662 (brown), and inhibitor dorsomorphin (gray). The 3 subunits of AMPK are shown in green (PRKA2), magenta (PRKAB1), and cyan (PRKAG1). (E) Binding model of MβCD with PRKAB1. (F) Binding model of MβCD with PRKAB2. MβCD is shown in sticks in yellow (carbon atom). AMPK is shown in ribbons and key interacting residues are shown in sticks in green (PRKAB1) or cyan (PRKAB2). Residue L146 within a flexible loop, which is positioned in the MβCD hole, is shown in magenta.
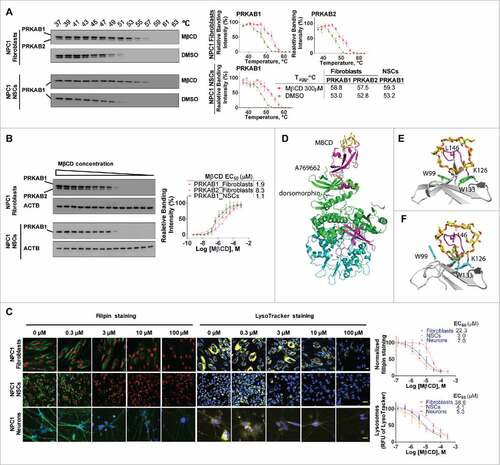
Figure 5. Pharmacological effect of MβCD is blocked by an inhibitor and mimicked by activators of AMPK. (A, B) Filipin staining for unesterified cholesterol accumulation in WT and NPC1 fibroblasts treated with the AMPK inhibitor dorsomorphin (DM) in the presence and absence of 100 µM MβCD. (C) Western blotting for LC3B and SQSTM1 levels in NPC1 fibroblasts treated with the indicated compounds (2 µM DM, 100 µM MβCD, or 100 nM baf. A1) for 24 h. LC3B-II and SQSTM1 expression were normalized to GAPDH expression. (D) Filipin staining after the cells were treated with the indicated compounds (1.25 µM RSVA 405, 200 µM A769662 or 100 nM baf. A1) for 4 d. (E) Western blotting for LC3B and SQSTM1 levels in NPC1 fibroblasts treated with AMPK activators (1.25 µM RSVA 405 or 200 µM A769662) for 24 h. LC3-II and SQSTM1 expression were normalized to GAPDH expression. Scale bar: 10 µm.
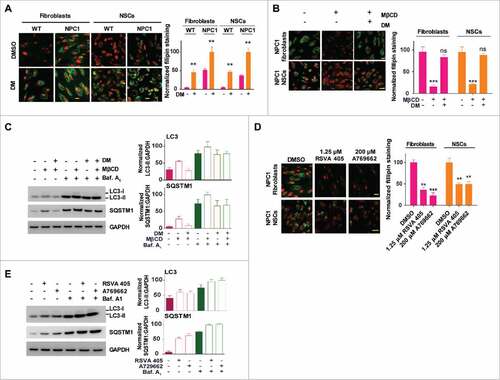
Figure 6. PRKAB1 or PRKAB2 is required for the effect of MβCD on cholesterol reduction, autophagy induction, and increase of autophagy flux. (A, B) Filipin staining of NPC1 fibroblasts treated with MβCD. (A) PRKAB1 or PRKAB2 expression was silenced by shRNA and the subunits re-expressed with transient transfection of either PRKAB1 or PRKAB2 activation vectors. (B) ATG12 expression was silenced by shRNA. All of the cells were treated with 100 µM MβCD or DMSO control for 4 d followed by the filipin staining assay. (C) NPC1 fibroblasts transfected with ATG12 shRNA or control shRNA were treated with 100 µM MβCD or DMSO control for 24 h, followed by western blot analysis with the indicated antibodies. LC3B-II, SQSTM1 and ATG12 expression were normalized to GAPDH expression. (D-G) MβCD effects on SNARE proteins interactions. (D) Immunoprecipitation and western blot analysis of 3 SNARE proteins (VAMP8, STX17 and SNAP29). WT fibroblasts with the PRKAB/AMPK β-subunit silenced or with AMPK β-subunit re-expression was treated with MβCD or DMSO for 24 h. Cells were lysed and directly immunoprecipitated with anti-VAMP8 antibody followed by western blot analysis with the indicated antibodies. (E) NPC1 and WT fibroblasts were treated with MβCD for the indicated times, followed by immunoprecipitation with anti-SNAP29 and western blot analysis with the indicated antibodies. (F) Immunofluorescence staining and colocalization of LC3 with VAMP8. Indicated WT fibroblasts, transiently transfected with TagRFP-LC3 lentiviral particles, were treated with 100 µM MβCD or DMSO for 24 h and stained with anti-VAMP8 antibody. The punctate structures of VAMP8 were colocalized with RFP-LC3 (yellow color in the merged images). Data represent mean ± SEM of 10 images. (G) NPC1 and WT fibroblasts, transiently transfected with TagRFP-LC3 lentiviral particles were treated with MβCD for the indicated times, followed by staining with anti-VAMP8 antibody. The colocalization of VAMP8 and RFP-LC3 puncta was analyzed as above. Abbreviations: PRKAB1 or PRKAB2 act., PRKAB1 or PRKAB2 activation vectors; Mock vec., mock vector; LY, lysosome; AP, autophagosome. Scale bar: 10 µm (yellow) and 1 µm (white).
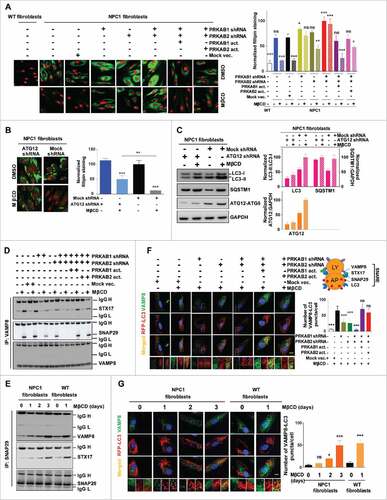
Figure 7. Schematic diagram of the mechanism of action of MβCD in NPC1 cells. After entering NPC1 cells by endocytosis, MβCD activates AMPK by binding to PRKAB/β-subunit, enabling PRKAA/α-subunit to be phosphorylated and activated. The activated AMPK sequentially phosphorylates downstream proteins, inducing autophagy. As a consequence of autophagy induction, autophagosome formation increases and autophagy flux is enhanced, as evidenced by an increase in SNARE complexes and consequential autophagosome-lysosome fusion. Ultimately, the impaired autophagy flux within NPC1 cells is restored by MβCD treatment.
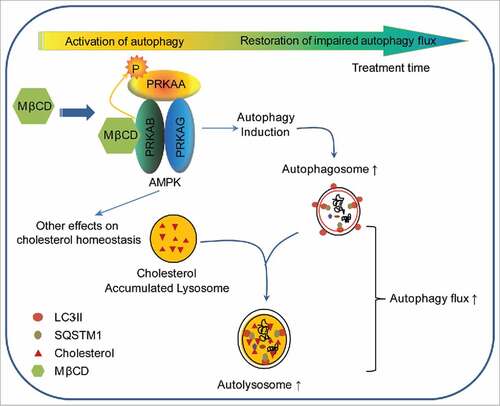
Table 1. Summary of the antibodies used in experiments.