Figures & data
Figure 1. Glycolysis level in different autophagicflux liver cancer cells. (A-C) The glycolysis level is inversely related to autophagic flux. (A) Relative glucose consumption and lactate (Lac) production in control versus rapamycin (20 μM)- or Baf A1 (100 nM)-treated Bel7402 cells after 24h treatment. P values were calculated using an unpaired t test. The values are presented as the means ± SEM, n = 3, *p<0.05, ***p<0.001. (B and C) SMMC7721 cells silenced with control, ATG5 or ATG7 shRNAs were subjected to measurement of glucose consumption and lactate production. The values are presented as the means ± SEM, n = 3, *p<0.05, **p<0.01. (D) ATG5 or ATG7 knockdown increases glycolysis. ECAR measured in SMMC7721 cells with control, ATG5 or ATG7 silencing using shRNAs. G, 10 mM glucose; O, 1 μM oligomycin; D, 50 mM 2-DG injection. Bar graph represents glycolysis and glycolytic capacity. The values are presented as the means ± SEM, n = 3, *p<0.05, **p<0.01.
Figure 2. HK2 is required for the regulation of glycolysis by autophagy. (A) Depletion of the autophagy essential gene ATG5 has no effect on the expression levels of genes encoding glycolytic proteins except HK2. Normalized quantification of mean gray intensity was determined from 3 separate experiments. The values are presented as the means ± SEM, *p<0.05. n.s., not significant. (B) HK2 is essential for glycolytic capacity. Relative glucose consumption and lactate (Lac) production in control versus HK2 knockdown cells. The values are presented as the means ± SEM, n = 3, *p<0.05, **p<0.01. The knockdown effect of the shRNA was examined by immunoblot. (C and D) HK2 is essential for the regulation of glycolysis by autophagy. (C) Relative glucose consumption and lactate production in SMMC7721 cells expressing control siRNA or siHK2 in the presence or absence of treatment with rapamycin (20 μM) or Baf A1 (100 nM). (D) SMMC7721 cells silenced with HK2 were re-expressed with exogenous HK2, and relative glucose consumption and lactate production were measured 16 h after treatment with rapamycin or Baf A1. The values are presented as the mean ± SEM, n = 3, *p<0.05, **p<0.01, n.s., not significant. (E) Impaired glycolysis activation in autophagy-deficient cells after HK2 knockdown. SMMC7721 cells with stable transfection of ATG5 shRNA were transfected with HK2 siRNA, After 48 h, the cells were subjected to ECAR analysis. (F) Ectopic expression of HK2 rescues the effect of HK2 silencing on glycolysis. SMMC7721 cells silenced with HK2 were re-expressed with exogenous HK2, then ECAR was measured. G, 10 mM glucose; O, 1 μM oligomycin; D, 50 mM 2-DG injection. Bar gragh represents glycolysis and glycolytic capacity. The values are presented as the means ± SEM, n = 3, *p<0.05, N.S., not significant.
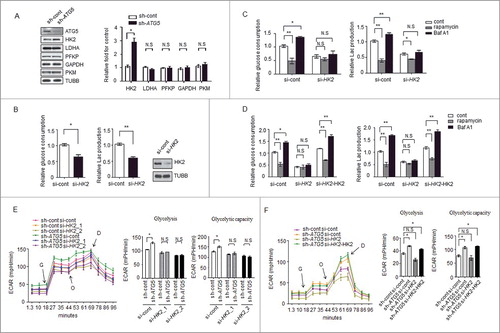
Figure 3. Autophagy selectively degrades HK2 via the autophagic receptor SQSTM1. (A) The mRNA levels of glycolytic genes in the control and ATG5 knockdown cells. The values are presented as the means ± SEM, n = 3. (B) The levels of HK2 mRNA in the cells subjected to rapamycin and Baf A1 treatment. The values are presented as the means ± SEM, n = 3. (C) Autophagy promotes the degradation of HK2. Immunoblot analysis of HK2 in SMMC7721 cells with rapamycin (10 μM, 20 μM) and Baf A1 (100 nM, 200 nM) treatment for 16 h. (D) HK2 is stabilized in ATG5 or ATG7 knockdown cells. SMMC7721 cells silenced with control, ATG5 or ATG7 shRNA were then treated with CHX for the indicated time. HK2 protein stability was determined by immunoblot analysis. (E) SQSTM1 is an autophagic receptor of HK2. Immunoblot analysis of HK2 from SMMC7721 cells bearing siRNA against SQSTM1, treated with Baf A1. (F) The interaction between HK2 and wild-type SQSTM1 but not UBA-deficient SQSTM1. SMMC7721 cells were transfected with GFP-tagged HK2 and FLAG-tagged wild-type SQSTM1 or its UBA domain deletion mutant. Immunoprecipitation assays were performed with antibodies against GFP and Flag.
Figure 4. TRAF6 promotes Lys63-linked ubiquitination of HK2 for autophagic degradation. (A) HK2 ubiquitination is stabilized after inhibition of autophagy. HEK293T cells were transfected with an HA-ubiquitin (HA-Ub) plasmid and treated with Baf A1 or left untreated. The cell lysates were subjected to immunoprecipitation using antibody against HK2. (B) HK2 ubiquitination with Lys63 ubiquitin linkages. HEK293T cells were cotransfected with plasmids expressing GFP-HK2 together with either wild-type, Lys63-mutated, or Lys48-mutated HA-Ub. The cell lysates were immunoprecipitated to affinity isolate the exogenous HK2 protein, and the polyubiquitinated linkage site was detected using an anti-HA antibody. (C) HK2 with Lys63-linked poly-ubiquitin chains is stabilized after inhibition of autophagy. HK2-expressing SMMC7721 cells cotransfected with or without shATG5 and treated as indicated for 12 h. (D) Immunoprecipitation analysis of the lysed HEK293T cells transfected with siRNAs against various E3 ligases. (E) Direct interaction between HK2 and TRAF6. Immunoprecipitation analysis of the interaction between endogenous HK2 and endogenous TRAF6.(F) Knockdown of TRAF6 results in accumulation of ubiquitinated HK2 associated with autophagic degradation. SMMC7721 cells were infected with control siRNA or TRAF6 siRNA, and this was followed by Baf A1 treatment for 12 h. Immunoprecipitation analysis of HK2 ubiquitination with the indicated antibodies. (G) HK2 is stabilized in TRAF6 knockdown cells. SMMC7721 cells silenced with control, TRAF6 siRNA were then treated with CHX for the indicated time. HK2 protein stability was determined by immunoblot analysis.
Figure 5. Ubiquitinated Lys41 in HK2 promotes the autophagic removal of HK2. (A) Schematic representation of HK2 protein structure and the deletion mutants generated to map the domains. (B) Vector control, wild-type HK2 and HK2 truncation mutants were cotransfected with a plasmid expressing HA-ubiquitin (HA-Ub) into HEK293T cells; immunoprecipitation analysis of HK2 ubiquitination was carried out with the indicated antibodies. (C) TRAF6 promotes the ubiquitination of N-terminal but not C-terminal truncation mutants. Wild-type HK2 and HK2 truncation mutants were cotransfected with FLAG-TRAF6 into HEK293T cells; immunoprecipitation was then performed and was followed by immunoblotting using the indicated antibodies. N, N-terminal truncation; C, C-terminal truncation; FL, full-length. (D) Identification of HK2 ubiquitination at K41 using mass spectrometry. GFP-HK2 and HA-Ub plasmids were cotransfected into HEK293T cells. At 24 h after transfection, Baf A1 (100 nM) was added for another 16 h. HK2 was purified by immunoprecipitation with an anti-GFP antibody and then analyzed using mass spectrometry. (E) HEK293T cells were transfected with the indicated plasmids then subjected to immunoprecipitation for the mutational assessment of the HK2 ubiquitination site. (F) Immunoblot assessment of HK2 stability in SMMC7721 cells transfected with either wild-type HK2 or K41-mutated HK2.
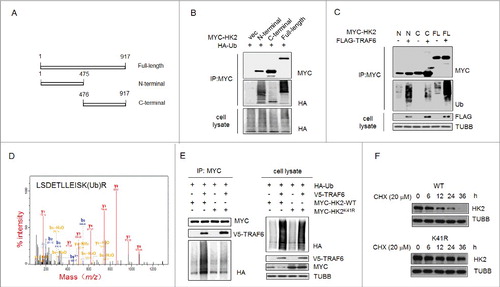
Figure 6. HK2 is correlated with SQSTM1 in clinical samples. (A) Immunoblot analysis of HK2, SQSTM1, MAP1LC3B and TRAF6 expression in tumors from 7 patients. (B) Correlation study of HK2, SQSTM1, and MAP1LC3B expression in the liver cancer TMA consisting of 129 samples. (C) Correlation study of HK2 and TRAF6 expression in the liver cancer TMA. (D) Kaplan-Meier plots of the overall survival of patients, stratified by expression of HK2 and SQSTM1. The data were obtained from the Sun Yat-sen University Cancer Center liver cancer dataset.
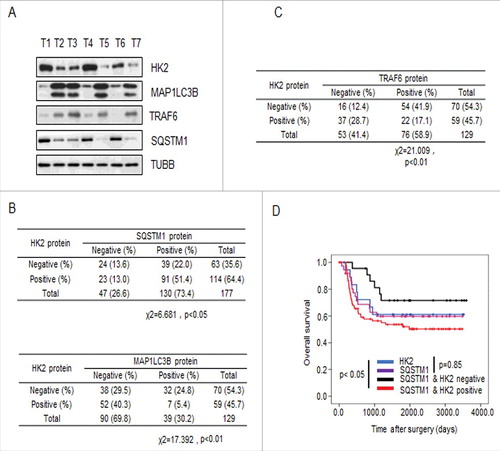
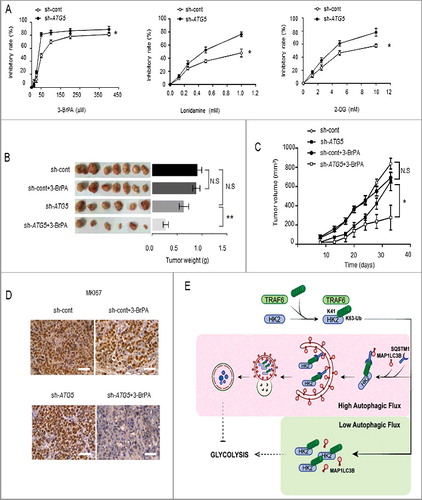
Figure 7. Autophagy-impaired liver cancers are more sensitive to glycolysis inhibition. (A) MTT assay showing SMMC7721 cells silenced with ATG5 shRNA were more sensitive to glycolysis inhibition in vitro. SMMC7721 cells transfected with control or ATG5 shRNA were then treated with the indicated doses of lonidamine, 2-DG and 3-BrPA for 24 h. Results are mean±SEM for experiments performed in triplicate. (B) The glycolysis inhibitor 3-BrPA inhibits the growth of autophagy-deficient xenograft tumors. SMMC7721 cells with stable knockdown of control or ATG5 were injected subcutaneously into the right flanks of nude mice. Two wk after the cells were injected, the mice in 2 groups were randomly separated into 4 groups. The mice were treated with either saline or 3-BrPA (5 mg/kg) by intraperitoneal administration every 3 d. When the tumor volume reached 450 mm3, the tumors were excised and photographed. The values are presented as the means ± SEM (n = 7–12). *p<0.05, **p<0.01. (C) Tumor volume curves on the indicated days. Tumor diameters were measured at fixed timepoints, and the tumor volumes were calculated. The values are presented as the means ± SEM, n = 7–12, *p<0.05 (Student t test). (D) Representative immunohistochemical staining results for MKI67 from tumor xenografts in nude mice. Scale bar: 50 μm. (E) A model depicting how autophagy might suppress glycolysis through the selective degradation of HK2. HK2 is subjected to K63-linked ubiquitination by TRAF6 at the K41 residue. Under high autophagic flux, SQSTM1 binds to and forms aggregates with the ubiquitinated HK2, then SQSTM1 recognizes MAP1LC3B and leads the aggregates to phagophores. Lysosomes fuse with the completed autophagosome and subsequently HK2 is degraded. In contrast, under low autophagic flux, the formation of a complex containing ubiquitinated HK2, SQSTM1, and MAP1LC3B is limited, and HK2 fails to be degraded in autolysosomes.