Figures & data
Figure 1. Activation of AKT induces the phosphorylation of ATG4B at Ser34 in HCC cells. (A) ATG4BCRISPR HepG2 cells (ATG4B hemizygous knockout cells) were transfected with the indicated expression plasmids. Then the whole cell lysates (WCL) were separately used for immunoblotting and immunoprecipitation assays with the corresponding antibodies. (B) HepG2 cells were transfected with MYC-AKT1 expression plasmid or control empty vector (EV). Then the cell lysates were obtained and treated with or without lambda phosphatase. Subsequently, the cell lysates were loaded onto SDS-PAGE gels with or without Phos-tag acrylamide and MnCl2 for immunoblotting assays. (C) The potential phosphorylation sites in ATG4B were predicted with motifscan (http://scansite.mit.edu/motifscan_seq.phtml), and the potential AKT1 phosphorylation motif 31RKYS34 in human ATG4B is shown. The red label represents the location of Ser34 in the 3D structure of the ATG4B protein. (D) ATG4BCRISPR HepG2 cells were transfected with Flag-ATG4BWT or Flag-ATG4BS34A expression plasmid in the presence or absence of MYC-AKT1WT expression vector. Then the cell lysates were prepared and loaded onto SDS-PAGE gels with or without Phos-tag acrylamide and MnCl2 for immunoblotting assays. The average ratio of F-p-ATG4B to t-ATG4B from 3 independent experiments is shown on the right. (E) ATG4BCRISPR HepG2 cells were transfected with the Flag-ATG4BWT expression plasmid in the presence or absence of MYC-AKT1WT expression vector. Then the cells were treated with 3 μM MK2206 or vehicle control (DMSO). Subsequently, the cell lysates were obtained for immunoblotting assays. (F) HepG2 cells were transfected with control siRNA or PTEN siRNA, and then the cell lysates were prepared and loaded onto SDS-PAGE gels with or without Phos-tag acrylamide and MnCl2 for immunoblotting assays. Data are mean ± SD from 3 independent experiments. *, P < 0.05; ns, no significance. MYC-AKT1WT, 1 × MYC-tagged wild-type AKT1 expression plasmid; 3 × Flag-ATG4BWT, 3 × Flag-tagged wild-type ATG4B expression plasmid; p-ATG4B, phosphorylated ATG4B; non-p-ATG4B, non phosphorylated ATG4B; t-ATG4B, total ATG4B; phos, SDS-PAGE gel containing Phos-tag acrylamide and MnCl2; Flag-ATG4BWT, 1 × Flag-tagged wild-type ATG4B expression plasmid; Flag-ATG4BS34A, 1 × Flag-tagged mutant ATG4B expression plasmid (in which Ser34 of ATG4B was mutated to Ala); F-p-ATG4B, the first band of phosphorylated ATG4B; S-p-ATG4B, the second band of phosphorylated ATG4B; LE, long exposure; SE, short exposure; p-ATG4B (S34), Ser34-phosphorylated ATG4B; p-AKT (S473), Ser473-phosphorylated AKT.
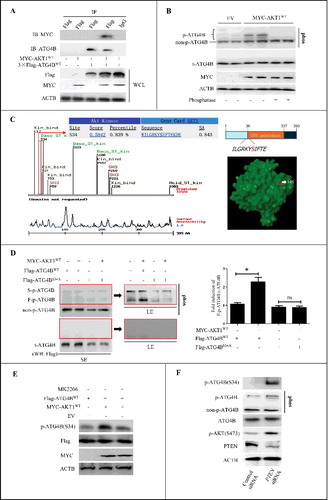
Figure 2. The Ser34 phosphorylation of ATG4B has little effect on autophagic flux in ATG4B-overexpressing HCC cells. (A and B) ATG4BCRISPR HepG2 cells were transfected with the indicated expression plasmids in the presence or absence of PTEN siRNA. Then the cell lysates were obtained for immunoblotting assays. The corresponding ratios of LC3-II to ACTB are listed below. (C) ATG4BCRISPR HepG2 cells were transfected with the indicated expression plasmids. Then the cells were treated with 10 nM bafilomycin A1 (Baf A1) or vehicle control for 3 h. Subsequently, the cell lysates were obtained for immunoblotting assays. The corresponding ratios of LC3-II (LE) to ACTB are listed below. (D and E) HepG2 cells stably expressing GFP-LC3 were transfected with the indicated expression plasmids or siRNAs, followed by treatment with 10 nM Baf A1 or vehicle control. Then the GFP-LC3 puncta in the cells were counted under a fluorescence microscope. The statistical diagrams represented the average numbers of GFP-LC3 puncta per cell (50 cells per sample were observed). Data are mean±SD from 3 independent experiments. *, P < 0.05; **, P < 0.01; ns, no significance. AKT1AA, 1 × MYC-tagged mutant AKT1 expression plasmid (in which both Thr308 and Ser473 were mutated to Ala); AKT1WT, 1 × MYC-tagged wild-type AKT1 expression plasmid; ATG4BWT, 1 × Flag-tagged wild-type ATG4B expression plasmid; ATG4BS34A, 1 × Flag-tagged mutant ATG4B expression plasmid (in which Ser34 of ATG4B was mutated to Ala); EV, empty vector; p-ATG4B (S34), Ser34-phosphorylated ATG4B; p-AKT (S473), Ser473-phosphorylated AKT; LC3-II (SE), LC3-II band with short exposure; LC3-II (LE), LC3-II band with long exposure.
Figure 3. The phosphorylation of ATG4B at Ser34 promotes the Warburg effect in HCC cells. (A) ATG4BCRISPR HepG2 cells were transfected with the indicated expression plasmids. Then the concentrations of L-lactate in the culture media were measured. (B) ATG4BCRISPR HepG2 cells were transfected with the indicated expression plasmids and siRNAs, and the concentrations of L-lactate in the culture media were determined. (C) ATG4BCRISPR HepG2 cells were transfected as in (A). Next, the concentrations of glucose in the culture media at different time points were detected separately. The time after 6 h of plasmids transfection was considered as the time “0 h” in the diagram. (D) ATG4BCRISPR HepG2 cells were seeded into 24-well microplates and treated as in (A). Then the oligomycin-sensitive respiration (OSR) was assayed. Data are mean ± SD from 3 independent experiments. *, P < 0.05; ns, no significance. AKT1WT, ATG4BWT and ATG4BS34A were the corresponding expression plasmids as described in .
Figure 4. The Ser34 phosphorylation of ATG4B contributes to the inhibition of F1Fo-ATP synthase activity and the elevation of mitoROS in HCC cells. (A-C) ATG4BCRISPR HepG2 cells were transfected with the indicated expression plasmids and siRNAs. Then the activity of the F1Fo-ATP synthase was examined. (D-F) ATG4BCRISPR HepG2 cells were transfected with the indicated expression plasmids and siRNAs. Then the level of mitoROS was detected with a fluorescence microplate reader. Data are mean ± SD from 3 independent experiments. *, P < 0.05; ns, no significance. a.u., arbitrary units; ATG4BC74A, 1 × Flag-tagged mutant ATG4B expression plasmid (in which Cys74 of ATG4B was mutated to Ala); ATG4BS34A,C74A, 1 × Flag-tagged mutant ATG4B expression plasmid (in which both Ser34 and Cys74 were mutated to Ala); AKT1AA, AKT1WT, ATG4BWT and ATG4BS34A were the corresponding expression plasmids as described in .
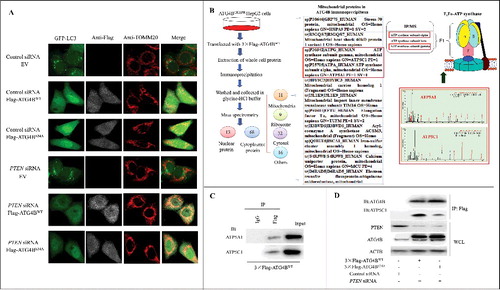
Figure 5. The phosphorylation of ATG4B at Ser34 promotes its mitochondrial translocation in HCC cells. (A) Cytosol and mitochondria fractions were separately isolated from HepG2 cells using a differential centrifugation strategy and an anti-TOMM22 magnetic beads method. Then the proteins in the cytosol and mitochondria were analyzed by immunoblotting assays, taking the total cellular proteins from the whole cell lysate (WCL) as a control. (B) HepG2 cells were transfected with the control siRNA or ATG7 siRNA. Then the WCL and mitochondrial proteins were detected by immunoblotting assays. (C) The mitochondrial fractions obtained from HepG2 cells using the differential gradient centrifugation strategy were treated with or without proteinase K (PK), and then subjected to immunoblotting assays. (D) The mitoplasts separated from HepG2 cells were treated with or without PK, and then subjected to immunoblotting assays. (E) The distributions of ATG4B in ATG4BCRISPR HepG2 cells and wild-type HepG2 cells were examined with immunogold-labeling electron microscopy assays (bar: 200 nm), and the ATG4B-positive dots were counted. Sixty random fields were observed from 3 samples (20 fields per sample), and the statistical diagram represents the average number of ATG4B-positive dots per field. (F and G) HepG2 cells were transfected with the indicated siRNAs or expression plasmids. Then the distributions of ATG4B in the cytosol and mitochondria were determined with immunogold-labeling electron microscopy assays, and the average ATG4B-positive dots in one field were calculated and statistically analyzed. (H) ATG4BCRISPR HepG2 cells were transfected with the indicated expression plasmids in the presence or absence of PTEN siRNA. Then the distributions of ATG4B in mitochondria were detected with immunogold-labeling electron microscopy assays, and the average ATG4B-positive dots in one field were calculated and statistically analyzed. (I) ATG4BCRISPR HepG2 cells were transfected with the indicated expression plasmids. Then the cells were stained with MitoTracker Red (MT-Red) and observed under a fluorescence confocal microscope (bar: 5 μm). The colocalization of GFP-puncta with mitochondria was evaluated. The data in the statistical diagram were from 30 random fields of 3 samples (10 fields per sample). Data are mean±SD from 3 independent experiments. *, P < 0.05; **, P < 0.01; ns, no significance. Mito, mitochondria; OMM, outer mitochondrial membrane; IMM, inner mitochondrial membrane; GFP-ATG4BWT, 1 × GFP-tagged wild-type ATG4B expression plasmid; GFP-ATG4BS34A, 1 × GFP-tagged mutant ATG4B expression plasmid (in which Ser34 of ATG4B was mutated to Ala); AKT1AA, AKT1WT, ATG4BWT and ATG4BS34A were the corresponding expression plasmids as described in .
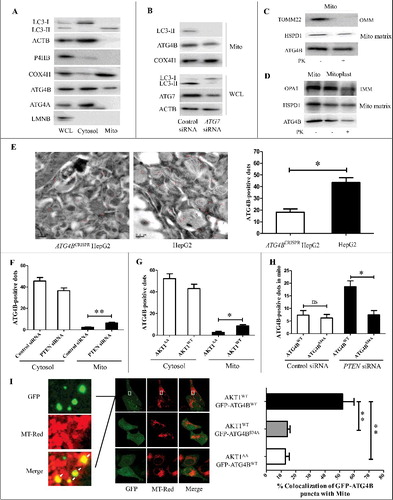
Figure 6. ATG4B is present in one complex with the subunits of the mitochondrial F1Fo-ATP synthase in HCC cells. (A) HepG2 cells stably expressing GFP-LC3 were transfected with the indicated siRNAs and expression plasmids. Then the cells were labeled with the indicated antibodies using immunofluorescence assays and observed under a fluorescence confocal microscope. Representative images are shown (bar: 10 μm). (B) ATG4BCRISPR HepG2 cells were transfected with the 3 × Flag-ATG4BWT expression plasmid. Then the whole cell lysate (WCL) was obtained for immunoprecipitation assays. Subsequently, the ATG4B antibody-precipitated complex was further subjected to mass spectrometry, taking the IgG-precipitated complex as a control. Three independently prepared lysates were used for immunoprecipitation assays. Only the proteins pulled down in all 3 independent IP-MS assays were selected as candidates, and the mitochondrial candidates in the ATG4B antibody-precipitated complex are listed. (C) HepG2 cells were transfected with the 3 × Flag-ATG4BWT expression plasmid, and then the cell lysates were subjected to immunoprecipitation assays. (D) ATG4BCRISPR HepG2 cells were transfected with the 3 × Flag-ATG4BWT expression plasmid. Then the cell lysates were obtained for immunoprecipitation and immunoblotting assays. 3 × Flag-ATG4BS34A, 3 × Flag-tagged mutant ATG4B expression plasmid (in which Ser34 of ATG4B was mutated to Ala); Flag-ATG4BWT, Flag-ATG4BS34A and 3 × Flag-ATG4BWT were the corresponding expression plasmids as described in .