
Figures & data
Figure 1. SQSTM1 levels increase in GBMs and inversely correlate with CTNNB1. (A) Representative immunostainings for SQSTM1 from astrocytoma grade II and GBM (grade IV) biopsies from the TMAs. Nuclei were counterstained with haematoxylin. Bar: 100 µm. (B) SQSTM1 mRNA levels in non-tumor, astrocytomas (grade II and III) and GBM tumors as analyzed by Gliovis platform. ***p<0.001 (Turkey's statistics). (C) CTNNB1 and SQSTM1 expression correlation as analyzed by Gliovis in GBM samples (Pearson correlation). (D) Primary cultures from astrocytoma grade II and GBMs grade IV, and GBM cell lines were analyzed for SQSTM1 and CTNNB1 by WB. (E) Different GBM (grade IV) primary cultures were immunoblotted for autophagic markers, CTNNB1 and the WNT target, CCND1. CTNNB1 or CCND1 levels inversely relate with autophagic markers (SQSTM1, BECN1 or MAP1LC3A/B-II) in a number of cases. ACTB/β-actin was used as a loading control.
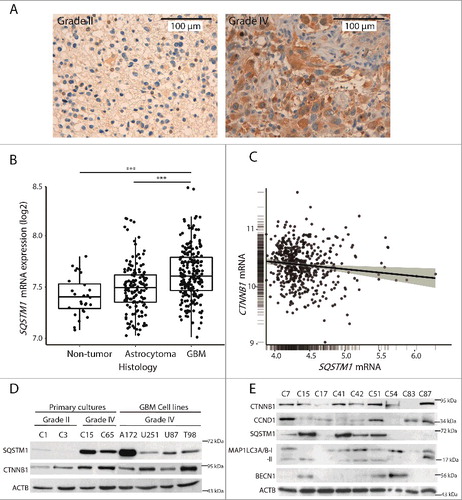
Figure 2. WNT-CTNNB1 signaling transcriptionally upregulates SQSTM1 in GBM. (A) GBM cell lines were treated with WNT3A (100 ng/ml) and FH535 (10 µM) for 24 h. SQSTM1 mRNA levels were analyzed by qPCR and data presented as fold induction vs. control normalized to GAPDH. Values are mean ± s.e.m of triplicate measurements of 3 independent experiments. (B) SQSTM1 immunoblotting analysis in A172, U251-MG and U87-MG GBM cell lines and C17 and C65 primary GBM cultures treated with FH535 (10 µM, 24 h). ACTB was used as a loading control. (C) TCF4 and SQSTM1 mRNA levels were examined by qPCR in control (scrambled shRNA; Scr) or TCF4-silenced (shRNA TCF4) U251-MG and U87-MG cell lines. (D) SQSTM1 protein levels in control cells (Scr) or TCF4-silenced GBM cell lines. (E and F) A172, U251-MG and U87-MG cells were transfected with CTNNB1 or control (GAPDH) siRNAs (E) or with WT and S37Y CTNNB1 plasmids (F) and SQSTM1 and CTNNB1 protein levels were analyzed after 48 h. *p<0.05, **p<0.01 and ***p<0.001
Figure 3. Inhibition of WNT-CTNNB1 signaling increases the autophagic flux in GBM. (A) Total cell lysates from A172, U251-MG and U87-MG cells untreated or incubated with FH535 (10 µM, 24 h) were immunoblotted for MAP1LC3A/B and ubiquitinated (Ub) proteins. (B and C) U251-MG and U87-MG GBM cell lines and C17 and C65 primary GBM cultures (B) were treated with FH535 as above (B) or with 50 ng/ml DKK1 (C) for 24 h plus Baf (5 nM) for the last 2 h. Cell lysates were immunoblotted for MAP1LC3A/B. Values indicate the fold increase of MAP1LC3A/B-II vs. untreated control cells. ACTB was used as a loading control. (D) Representative images from U87-MG cells transfected with the ptfLC3 plasmid and treated with the indicated drugs. Pictures correspond to merge of red and green channels. Cells with red and green colocalizing (yellow) fluorescent MAP1LC3A/B puncta show autophagosomes, whereas red-only fluorescent MAP1LC3A/B dots indicate autolysosomes. Bar: 50 µm. The numbers of green and red puncta/cell were calculated and shown as a bar graph (note that whereas in CQ there is a balance between red and green puncta, the other treatments show a marked increase of red dots). Data are mean ± s.e.m of at least 40 different cells from 10 different fields from 3 independent experiments. *** p<0.001.
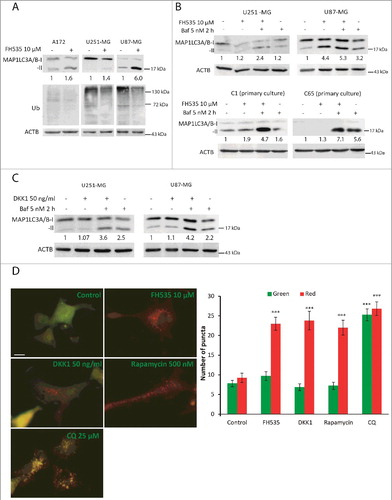
Figure 4. TCF inhibition increases SQSTM1 and MAP1LC3A/B puncta in GBM. SQSTM1 (A) and MAP1LC3A (B) immunostaining in the U87-MG GBM cell line. Cells were treated in the absence or presence of FH535 (10 µM, 24 h) and CQ (25 µM, last 2 h). Insets show enlarged areas. The number of puncta was counted using ImageJ. Plots show the increase in the number of MAP1LC3A (A) and SQSTM1 (B) puncta when comparing the FH535 and CQ doubly-treated cells vs. CQ-treated cells to the number of puncta obtained in FH535-treated cells vs. untreated cells. **p<0.01. Bars: 20 µm.
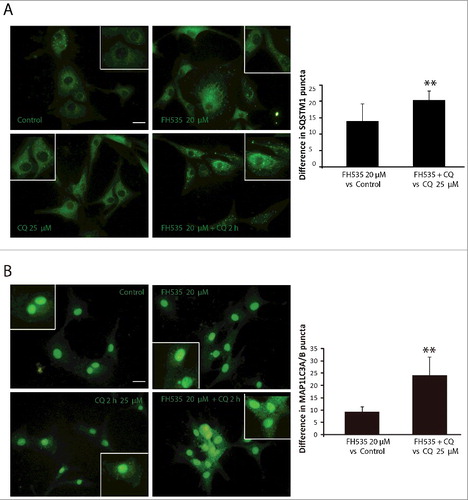
Figure 5. Inhibition of TCF diminishes MTOR signaling and promotes TFEB nuclear translocation. (A) U251-MG and U87-MG cells were treated with 10 or 20 µM FH535 or 5 µM rapamycin for 24 h. Western blots for phosphorylated RPS6KB (Thr389), EIF4E (Ser209), total RPS6KB, total EIF4E and ATF4 levels were analyzed as MTOR targets. Phosphorylated AKT (Ser473) and MAPK (Tyr202/204) were analyzed and compared to total AKT and MAPK. ACTB was used as a loading control. Plots represent the quantification of phosphorylated RPS6KB, phosphorylated EIF4E and ATF4 levels normalized vs. ACTB (shown as percent of the control; *p <0.05 and *** p<0.001; n≥3). (B) Immunoblot for TFEB from U251-MG, U87-MG and A172 untreated cells, cells treated with FH535 or deprived of serum for 24 h. The TFEB upper band corresponds to the phosphorylated/inactive TFEB form, whereas the lower band corresponds to dephosphorylated and active TFEB, as indicated by the deprivation condition. Small panels show A172 cell lysates treated with or without AP, demonstrating the TFEB band shift towards the lower band in the presence of the enzyme. ACTB was used as a loading control. The plot represents the quantification of the dephosphorylated:phosphorylated TFEB ratio (lower:upper band) (*p <0.05 and **p<0.01; n≥3). (C) TFEB immunostaining (green) overlapped with Hoechst staining (blue) in U251-MG and U87-MG cell lines and C65 primary GBM cells, after treatment with FH535 or serum deprivation and compared to control cells. Note that in all conditions except controls (where TFEB immunostaining appears perinuclear; arrows), TFEB immunostaining is predominantly nuclear and colocalizes with Hoechst. Bar: 50 µm. Single-channel TFEB pictures can also be found Figure S4. (D) Quantification of nuclear TFEB immunostaining in U251-MG, U87-MG and C65 GBM cells treated as indicated. *** p<0.001.
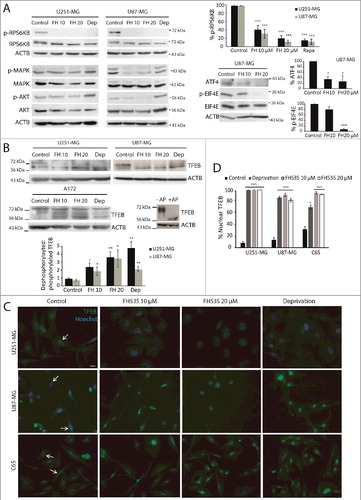
Figure 6. TCF inhibition decreases GBM cell proliferation. (A) U251-MG and U87-MG cells were treated with FH535 (10 µM), Baf (5 nM) and CQ (15 µM). After 24 and 48 h of treatment, cells were counted using trypan blue staining. (B) Control (shRNA scr) and TCF4-silenced (shRNA TCF4) U87-MG cells were counted after 24, 48 and 72 h of plating. (C) Control (shRNA scr) and TCF4-deficient U87-MG cells were grown in colony-forming assays and colony numbers counted. Representative images are shown. (D) U251-MG and U87-MG cells were treated as indicated for 48 h before cell counting. The plot shows the number of cells compared to the respective control at 48 h. The dashed line indicates the number of plated cells. FH535 and Baf/CQ treatments reduced cell proliferation, whereas the dual treatments reduced the number of cells below the line (indicating cell death; see ). (E) U251-MG and U87-MG cell viability was measured using the WST-1 reagent. Treatments were performed alone or in combination for 48 h at the indicated concentrations. * p-value compares to FH535 alone, and # p-value compares to the autophagy blocker (Baf or CQ) treatment alone; * or # p <0.05 and ** or ## p<0.01. (F) Control and TCF4-deficient U87-MG cells were treated with autophagy blockers (Baf and CQ) for 48 h and cells were subjected to the WST-1 viability assay. *p<0.05, **p<0.01.
Figure 7. Dual inhibition of TCF and autophagy sensitizes to cell death. (A) U251-MG and U87-MG cells were analyzed by ANXA5-PI assay to calculate live, early and late apoptotic and necrotic cell populations. Cells were treated as indicated for 48 h. *p<0.05. (B) U251-MG cells incubated with single or dual treatments as above and stained with Hoechst. Condensed apoptotic nuclei are observed after dual treatment with TCF inhibitor and CQ. Bar: 50 µm. (C) Immunoblot for CASP8 in U87-MG cells shows an active cleaved CASP8 (p18) fragment upon FH535 and Baf double treatment. p43 corresponds to a CASP8 pro-fragment [Citation36]. ACTB was used as a loading control. (D) ANXA5-PI assay performed in control (empty vector) or in CASP8-silenced cells treated with FH535 and Baf for 48 h. (E) ANXA5-PI assay from control U87-MG cells (scr shRNA) or shRNA SQSTM1 cells treated as indicated for 48 h (n.s., non significant). (F) Immunoblots showing reduced CASP8 (top) and SQSTM1 (bottom) protein levels upon expression of specific shRNAs in U87-MG cells. ACTB was used as a loading control.
![Figure 7. Dual inhibition of TCF and autophagy sensitizes to cell death. (A) U251-MG and U87-MG cells were analyzed by ANXA5-PI assay to calculate live, early and late apoptotic and necrotic cell populations. Cells were treated as indicated for 48 h. *p<0.05. (B) U251-MG cells incubated with single or dual treatments as above and stained with Hoechst. Condensed apoptotic nuclei are observed after dual treatment with TCF inhibitor and CQ. Bar: 50 µm. (C) Immunoblot for CASP8 in U87-MG cells shows an active cleaved CASP8 (p18) fragment upon FH535 and Baf double treatment. p43 corresponds to a CASP8 pro-fragment [Citation36]. ACTB was used as a loading control. (D) ANXA5-PI assay performed in control (empty vector) or in CASP8-silenced cells treated with FH535 and Baf for 48 h. (E) ANXA5-PI assay from control U87-MG cells (scr shRNA) or shRNA SQSTM1 cells treated as indicated for 48 h (n.s., non significant). (F) Immunoblots showing reduced CASP8 (top) and SQSTM1 (bottom) protein levels upon expression of specific shRNAs in U87-MG cells. ACTB was used as a loading control.](/cms/asset/4ac20ba7-a920-41da-96c8-f22af77dcdeb/kaup_a_1423439_f0007_b.gif)
Figure 8. The cell death induced by the dual inhibition of TCF and autophagy is reversed in ATG5-depleted cells. (A) Immunoblot for SQSTM1 from U87-MG cells transduced with control lentiviruses or carrying an shRNA against ATG5, untreated or treated as indicated. SQSTM1 is upregulated by the FH535 treatment both in control and in ATG5-deficient cells. (B) Immunoblot showing reduced ATG5 levels in cells expressing shRNA against ATG5 vs. control cells. ACTB was used as a loading control. (C) ANXA5-PI assay from control U87-MG cells or cells carrying an shRNA against ATG5, untreated or treated with the dual treatment (FH535 + Baf) for 48 h (n.s., non significant). *p<0.05
Figure 9. Dual inhibition of TCF and autophagy in vivo reduces tumor growth. (A) Representative pictures of mice xenografts formed by control or TCF4-silenced U87-MG cells. Tumors were allowed to grow for 30 d. Upon mouse sacrifice, tumors were collected and prepared for immunostaining. Left, graph of tumor growth over time of mice xenografts formed by U87-MG cells (control or TCF4-silenced). Right, representative images of tumors from each condition. (B) SCID mice were injected with control or TCF-4 silenced U87-MG cells and once tumors were formed, animals were treated daily intraperitoneally with CQ (25 mg/kg) or PBS for 15 d. Left, graph of tumor growth over time. Results are mean ± s.e.m. Right, representative images of tumors. (C) Immunostaining against MKI67 and SQSTM1 from control or TCF4-silenced U87-MG xenografted tumors treated with CQ or vehicle. Bar: 100 µm. *p<0.05, ***p<0.001. (D) Model for the induction of autophagy upon WNT signaling inhibition and GBM cell death by combined targeting of TCF-CTNNB1 and autophagy. Interfering with TCF-CTNNB1 function de-represses SQSTM1, which increases autophagic flux and decreases proliferation. DKK1 also increases autophagy flux, suggesting that autophagy can be regulated from the WNT receptor level. Elevated autophagic flux associates with decreased MTOR activity and nuclear translocation of dephosphorylated TFEB that can transcribe more SQSTM1. WNT-dependent GSK3B inhibition leads to MTOR activation [Citation21]; however, the mechanism by which TCF-CTNNB1 inhibition reduces MTOR activity is unknown (dashed arrow). Increased autophagy resulting from TCF inhibition elicits GBM cell death by autophagy blockers, through a mechanism that requires SQSTM1 and CASP8 cleavage, probably in phagophores. WNT R, WNT receptor.
![Figure 9. Dual inhibition of TCF and autophagy in vivo reduces tumor growth. (A) Representative pictures of mice xenografts formed by control or TCF4-silenced U87-MG cells. Tumors were allowed to grow for 30 d. Upon mouse sacrifice, tumors were collected and prepared for immunostaining. Left, graph of tumor growth over time of mice xenografts formed by U87-MG cells (control or TCF4-silenced). Right, representative images of tumors from each condition. (B) SCID mice were injected with control or TCF-4 silenced U87-MG cells and once tumors were formed, animals were treated daily intraperitoneally with CQ (25 mg/kg) or PBS for 15 d. Left, graph of tumor growth over time. Results are mean ± s.e.m. Right, representative images of tumors. (C) Immunostaining against MKI67 and SQSTM1 from control or TCF4-silenced U87-MG xenografted tumors treated with CQ or vehicle. Bar: 100 µm. *p<0.05, ***p<0.001. (D) Model for the induction of autophagy upon WNT signaling inhibition and GBM cell death by combined targeting of TCF-CTNNB1 and autophagy. Interfering with TCF-CTNNB1 function de-represses SQSTM1, which increases autophagic flux and decreases proliferation. DKK1 also increases autophagy flux, suggesting that autophagy can be regulated from the WNT receptor level. Elevated autophagic flux associates with decreased MTOR activity and nuclear translocation of dephosphorylated TFEB that can transcribe more SQSTM1. WNT-dependent GSK3B inhibition leads to MTOR activation [Citation21]; however, the mechanism by which TCF-CTNNB1 inhibition reduces MTOR activity is unknown (dashed arrow). Increased autophagy resulting from TCF inhibition elicits GBM cell death by autophagy blockers, through a mechanism that requires SQSTM1 and CASP8 cleavage, probably in phagophores. WNT R, WNT receptor.](/cms/asset/9f23cddb-c199-43d1-95d1-7c2ae5209810/kaup_a_1423439_f0009_oc.jpg)