Figures & data
Figure 1. DIRAS family expression is downregulated in ovarian cancers and cancer cell lines. (A) Normal ovaries and tumor tissue microarrays with 122 cases represented were analyzed using immunohistochemistry with anti-DIRAS1 and anti-DIRAS2 antibodies and scored 0 to 3. Examples from the tumor array representing the score 0 (no expression), 1 (low expression), 2 (moderate expression) and 3 (high expression) are shown with 10x magnification, and enlarged 40x magnification insets for each antibody. Bar: 100 µm. (B) The fraction of ovarian cancers with DIRAS family expression. (C) The correlation between disease-free survival and DIRAS family member expression. Each circle represents one patient sample. The median disease-free survival time is listed on top. (D) The fraction of ovarian cancers with DIRAS2 expression. (E) The correlation between disease-free survival and overall survival by staining score of DIRAS1. Each circle represents one patient sample. Asterisk denotes significant difference (*p<0.05 or **p<0.01). (F) Kaplan-Meier overall survival analysis of DIRAS1 expression by staining score. (G) Kaplan-Meier overall survival analysis of DIRAS2 expression by staining score. Statistical significance was determined by Mantel-Cox Log-rank analysis of the overall survival. (H) DIRAS1 and DIRAS2 protein expression levels were determined in normal ovarian epithelial scrapings (NOE), 11 ovarian cancer primary tumors and 14 ovarian cancer cell lines using western blot analysis.
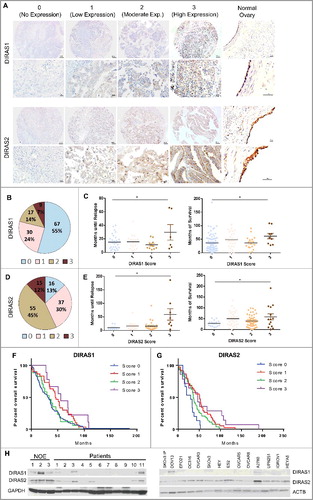
Figure 2. Re-expression of DIRAS1 or DIRAS2 inhibits ovarian cancer cell growth in vitro. (A and B) Two distinct subclones of OVCAR8-DIRAS1 or OVCAR8-DIRAS2 cells were seeded at 400 cells/well and doxycycline (1 µg/mL) was added to the media every 48 h for 6 d to induce gene expression. Colonies were allowed to grow for 2 wk and then stained with Coomassie Brilliant Blue. Percentage of growth inhibition was determined for 3 independent experiments all performed with triplicate samples. (C) OVCAR8-Praental cells were seeded at 400 cells/well and doxycycline (1 µg/mL) was added to the media every 48 h for 6 d. Colonies were allowed to grow for 2 wk and then stained with Coomassie Brilliant Blue. Percentage of growth inhibition was determined for 3 independent experiments all performed with triplicate samples. (D–I) Similar experiments were carried out in SKOv3-IP-inducible lines and Hey-A8-inducible lines or their parental control cells, seeded at 800 and 600 cells per well, respectively. Asterisk denotes significant difference (*p<0.05 or **p<0.01).
Figure 3. Re-expression of DIRAS family members induces autophagy. OVCAR8-inducible cells were treated with or without doxycycline for 18–48 h with or without the presence of chloroquine (5 µM). (A) Cell lysate was collected and western blot analysis was performed to examine the conversion of LC3-I to LC3-II, SQSTM1/p62 levels, and expression of DIRAS1 or DIRAS2. ACTB/β-actin was used as a loading control. Upon re-expression of DIRAS1 or DIRAS2 we observed decreased SQSTM1 levels and increased conversion to LC3-II, which was further enhanced by the addition of chloroquine. (B and C) Immunofluorescence staining of DIRAS1 or DIRAS2 (green) and LC3B (red) was performed to document the formation of autophagosomes. Scale bar: 10 µm. (D and E) Fluorescence microscopy of OVCAR8-DIRAS1 or OVCAR8-DIRAS2 ovarian cancer cells with or without doxycycline treatment (1 µg/mL), for 18–30 h to induce gene expression, 24 h post infection with GFP-mCherry-LC3B-expressing lentivirus to visualize autophagic flux. Yellow puncta indicate the presence of GFP and mCherry signal. Red puncta indicate the fusion of the autophagosome with the lysosome and quenching of GFP. Scale bar: 10 µm. Average puncta counts were determined for each time point and condition using ImageJ and plotted with GraphPad Prism. Data were collected over 3 independent experiments and more than 50 cells were analyzed per condition. Asterisk denotes significant difference as determined by Student t test (*p<0.05 or **p<0.01). (F) TEM images of induced or noninduced OVCAR8-DIRAS1 or DIRAS2 cells. Red arrows indicate typical double-membrane autophagosomes. Scale bars: 5 µm and 5 nm for close-up image. Data were collected over 3 independent experiments. Asterisk denotes significant difference (*p<0.05 or **p<0.01).
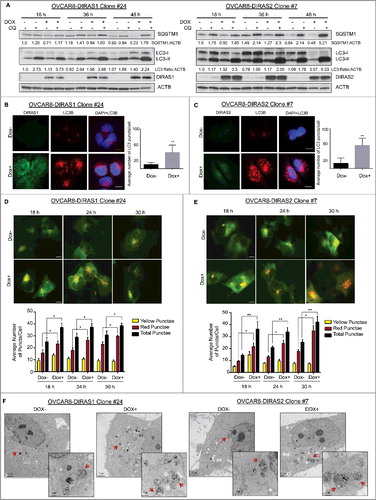
Figure 4. DIRAS1 and DIRAS2 growth inhibition is dependent upon functional autophagy. Using CRISPR/Cas9 double-nickase control plasmid or ATG7 sgRNA, OVCAR8-DIRAS1 and OVCAR8-DIRAS2 inducible cells were generated from single-cell clones. (A and B) Western blot analysis revealed that control cells induced autophagy upon re-expression of DIRAS1 or DIRAS2 whereas ATG7−/− cells did not. Knockout efficiency was observed by western blot analysis of ATG7. (C and D) Clonogenic assays were performed with these sublines, documenting that growth inhibition seen by re-expressing DIRAS1 or DIRAS2 is dependent upon functional autophagy. Experiments were completed in triplicate. Asterisk denotes significant difference (*p<0.05 or **p<0.01).
Figure 5. DIRAS1 and DIRAS2 induce autophagy by inhibiting PI3K and regulating the FOXO3 transcription factor. (A) OVCAR8-inducible cells were treated with or without doxycycline for 24 h to induce DIRAS1 or DIRAS2 gene expression. Cell lysate was collected and western blot analysis was performed. Re-expression of DIRAS1 and DIRAS2 resulted in a significant decrease in p-AKT (S473) and p-MAPK/ERK (42/44). p-MTOR (S2488), a downstream target of AKT and key inhibitor of autophagy, was also decreased following re-expression of DIRAS1 or DIRAS2. (B) ImageJ quantification was performed for 3 independent western blot analyses to determine the relative expression of p-AKT, p-MAPK/ERK and p-MTOR following re-expression of DIRAS1 or DIRAS2 (*p<0.05; **p<0.01). (C) Cell lysate was collected and western blot analysis was performed to examine the nuclear localization of FOXO3 or TFEB. PARP and TUBA/α-tubulin were used as nuclear and cytoplasm extraction controls. The numbers below the blots correspond to ImageJ densitometry of the blot. (D) Immunofluorescence staining of FOXO3 and TFEB nuclear localization following re-expression of DIRAS1 or DIRAS2. Scale bars: 20 µm. (E and F) OVCAR8-inducible cell lines were treated with or without doxycycline for 24 h to induce gene expression of DIRAS1 or DIRAS2. mRNA expression of LC3B, ULK1, RAB7, GABARAP, BECN1, and LAMP1 was measured by qRT-PCR. (E) Re-expression of DIRAS1 in OVCAR8 ovarian cancer cells increased mRNA expression of ULK1, RAB7, GABARAP, BECN1 and LAMP1. (F) Re-expression of DIRAS2 in OVCAR8 increases mRNA expression of LC3B, ULK1, RAB7, GABARAP, and BECN1.
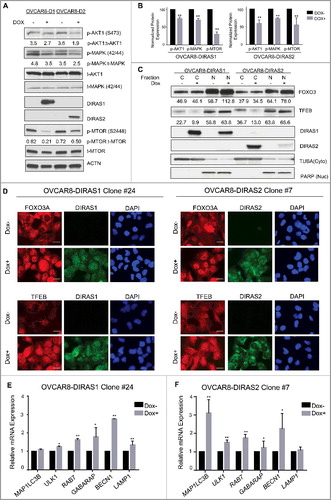
Figure 6. Transient expression of murine DIRAS1 and DIRAS2 inhibit murine ovarian cancer cell clonogenic growth and induce autophagy. Long-term clonogenic growth was assessed following transient overexpression of murine DIRAS1 and DIRAS2 in ID8 (A), IG10 (B), TBR2 (C) and TKOOV10 (D) murine ovarian cancer cell lines. Selection was performed with G418 for 2 wk until colonies reached at least 50 cells in size. Columns represent the mean and bars represent the S.D. The experiment was performed at least 3 independent times. Asterisk denotes significant difference (**p<0.01). ID8 (A), IG10 (B), TBR2 (C) and TKOOV10 (D) murine ovarian cancer cells were seeded at 0.3 × 10⁶ cells per well and transfected with empty vector, DIRAS1- or DIRAS2-encoding plasmid DNA and treated with or without chloroquine (5 µm) for 24 h prior to lysing and immunoblotting as indicated. Densitometry was measured with ImageJ and experiments were performed at least 3 times. Autophagic flux was determined by the ratio of LC3-II:LC3-I and normalized to the loading control, ACTB/β-actin.
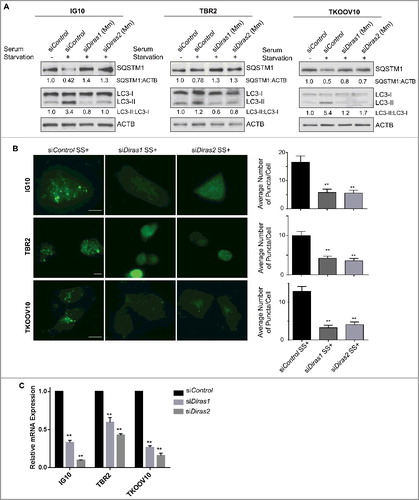
Figure 7. Murine DIRAS1 and DIRAS2 are essential for starvation-induced autophagy. Mouse ovarian cancer cells were transfected with control, murine Diras1 or murine Diras2 siRNA for 72 h prior to autophagy induction by serum starvation for 4–16 h. (A) Western-blot analysis was performed as indicated and documented a decrease in serum starvation-induced autophagic flux following knockdown of DIRAS1 or DIRAS2. (B) Immunofluorescence staining of IG10, TBR2, and TKOOV10 cells for LC3 puncta following autophagy induction by serum starvation for 16 h was performed. Quantification of puncta/cell was calculated for at least 100 cells per experiment, for 3 experiments. Columns indicate the mean and bars represent the S.D. Significance denoted by the asterisk (*p<0.05, **p<0.01). (C) qRT-PCR analysis of murine Diras1 and murine Diras2 mRNA expression following knockdown with siRNA. Columns indicate the mean and bars represent the s.d. Significance denoted by the asterisk (*p<0.05, **p<0.01).