Figures & data
Figure 1. RPGRIP1L deficiency results in a decreased autophagic activity. (A to Aii) Immunofluorescence staining of ATG5 in wild-type and Rpgrip1l-negative MEFs. Cells were visualized by marking F-ACT (Phalloidin 488, green), and cells as well as cell nuclei were visualized by marking TUBG (blue). ATG5-positive autophagosomes were stained in red (n = 3). Scale bar: 5 µm. Either the number of ATG5-positive vesicles (Ai) or the ratio between the area of ATG5-positive vesicles and the total cell area (Aii) were quantified. The amount and the area of ATG5-positive vesicles per cell are significantly reduced. (B to Bii) Immunofluorescence staining on MEFs isolated from wild-type and Rpgrip1l-negative mouse embryos. Cells were visualized by marking F-ACT (Phalloidin 488, green) and cells as well as cell nuclei were visualized by marking TUBG (blue). Autophagosomes were stained by visualizing MAP1LC3B (red) (n = 4). Scale bar: 5 µm. Either the number of MAP1LC3B-positive vesicles (Bi) or the ratio between the area of MAP1LC3B-positive vesicles and the total cell area (Bii) were quantified. The amount and the area of MAP1LC3B-positive vesicles per cell are significantly reduced. (C) Western blot analysis of MAP1LC3B-II in MEFs (n = 3). The amount of MAP1LC3B-II is reduced in Rpgrip1l-negative MEFs. (D) Autophagic flux assay performed on MEFs serum starved for 24 h including 6-h CQ treatment (n = 4). Inhibition of lysosomal fusion via CQ-treatment leads to an accumulation of MAP1LC3B-II in wild-type but not in Rpgrip1l-deficient MEFs. (E) Autophagic flux assay performed on MEFs serum starved and CQ treated for 6 h (n = 8). Inhibition of lysosomal fusion via CQ treatment leads to an accumulation of MAP1LC3B-II in wild-type but not in Rpgrip1l-deficient MEFs. (F) Immunofluorescence-based measurement of OFD1 as an autophagic substrate at the base of wild-type and Rpgrip1l-deficient MEFs. The axoneme was stained with Ac-TUBA (green), the basal body with TUBG (blue) and OFD1 was stained in red (n = 3). Scale bar: 2.5 µm in the overview and 1 µm in the insets. The amount of OFD1 is significantly increased at the base of rpgrip1l−/− MEFs. (G) Immunofluorescence-based quantification of the BBS4 amount at the base of wild-type and rpgrip1l−/− MEFs (n = 6). The axoneme was marked with Ac-TUBA (green), the basal body with TUBG (blue), and BBS4 was stained in red. Scale bar: 1 µm. The amount of BBS4 found at the base of Rpgrip1l-deficient cilia is significantly decreased. (A to G) Asterisks indicate statistically significant differences. p.d.u., procedure defined unit.
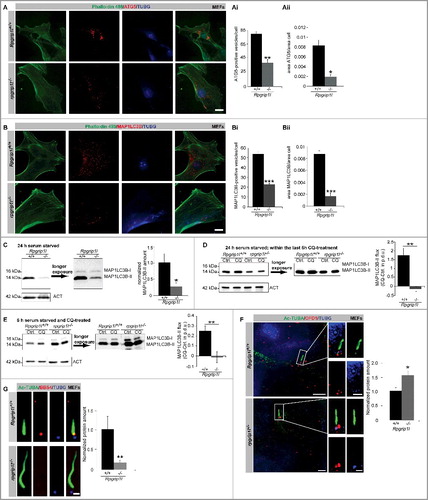
Figure 2. RPGRIP1L deficiency leads to upregulated MTORC1 signaling. (A) Western blot studies for phospho-(Ser2448)-MTOR in MEFs (n = 3). The amount of phospho-(Ser2448)-MTOR is increased in total cell lysates of Rpgrip1l-negative MEFs. Nonphosphorylated MTOR was used for normalization, while ACT served as a loading control. (B) Immunofluorescence-based measurement of cell size of wild-type and rpgrip1l−/− limb bud cells. The cells were visualized with TRITC-Phalloidin marking F-ACT to monitor the cell size (in both cases: n = 4). For better visualization the same cells were depicted without and with cell size indication (yellow dotted lines). The cell size of rpgrip1l−/− limb bud cells is significantly increased. (C) Semiquantitative PCR analysis for Hif1a, a target of MTORC1 signaling (n = 3). The expression of Hif1a is almost doubled in Rpgrip1l-deficient MEFs. For better visualization of the DNA bands, the gel electrophoresis photo was color inverted. (D) Immunofluorescence-based measurement of the OFD1 amount at the base of wild-type and Rpgrip1l-negative MEFs treated with either DMSO (control) or rapamycin. The axoneme was stained with Ac-TUBA (green), the basal body with TUBG (blue), and OFD1 was stained in red (n = 4). Scale bar: 1 µm. Rapamycin treatment resulted in a significant reduction of the OFD1 amount at the ciliary base in both genotypes. (A to D) Asterisks indicate statistically significant differences. (D) The most important significant differences are written in bold.
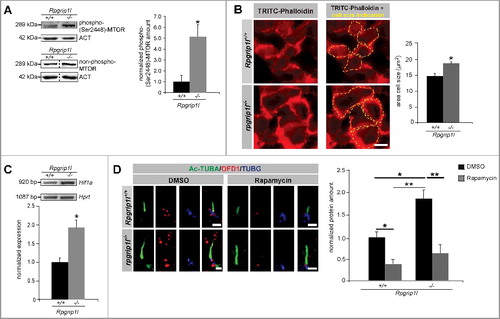
Figure 3. RPGRIP1L deficiency regulates autophagy not by governing SHH signaling but by controlling AKT1 signaling. (A) Western blot studies for TSC1 (n = 3). The amount of TSC1 is unchanged in Rpgrip1l-deficient MEFs compared to their wild-type littermates. ACT served as a loading control. (B) Western blot studies for phospho-(Ser939)-TSC2. Nonphosphorylated TSC2 was used for normalization, while ACT served as a loading control (n = 3). The amount of phospho-(Ser939)-TSC2 is unaltered comparing wild-type and Rpgrip1l-deficient MEFs. Non-phosphorylated TSC2 was used for normalization, and ACT serves as a loading control. (C) Western blot studies for phospho-(Ser473)-AKT1. Non-phosphorylated AKT1 was used for normalization, while ACT served as a loading control (n = 3). The amount of phospho-(Ser473)-AKT1 is significantly elevated in rpgrip1l−/− MEFs. (D) Immunofluorescence studies in wild-type MEFs. Pictures were obtained using 3D-SIM. The ciliary axoneme was stained with Ac-TUBA (green), the basal body with TUBG (blue). Phospho-(Ser473)-AKT1 was stained in red and is located at the primary cilium of wild-type MEFs. Scale bar: 1 µm. (E) Immunofluorescence-based quantification of phospho-(Ser473)-AKT1 at wild-type and Rpgrip1l-deficient cilia in MEFs. The axoneme was stained with Ac-TUBA (green), the basal body with TUBG (blue) and phospho-(Ser473)-AKT1 was stained in red (n = 3). Scale bar: 1 µm. The amount of phospho-(Ser473)-AKT1 is significantly increased at the cilia of rpgrip1l−/− MEFs. (F) Immunofluorescence studies in wild-type MEFs. Pictures were obtained using 3D-SIM. The ciliary axoneme was stained with Ac-TUBA (green), the basal body with TUBG (blue). Phospho-(Ser2448)-MTOR was stained in red and is located at the base of primary cilia of wild-type MEFs. Scale bar: 1 µm. (G) Immunofluorescence-based measurement of phospho-(Ser2448)-MTOR at wild-type and Rpgrip1l-deficient cilia in MEFs. The axoneme was stained with Ac-TUBA (green), the basal body with TUBG (blue) and phospho-(Ser2448)-MTOR was stained in red (n = 3). Scale bar: 1 µm. The amount of phospho-(Ser2448)-MTOR is significantly increased at the base of rpgrip1l−/− MEFs. (H) Quantitative real-time reverse transcriptase-PCR studies for Ptch1 in SAG-treated Rpgrip1l-deficient MEFs compared with SAG-treated wild-type MEFs (n = 3). The relative induction of Ptch1 in Rpgrip1l-deficient MEFs is reduced about 60%. (I) Immunofluorescence studies on wild-type and Rpgrip1l-deficient MEFs after GLI1 overexpression. The cells were visualized by marking F-ACT (Phalloidin 405, blue), ATG5 was stained in red (n = 3). In the single channel images the F-ACT staining is shown in white to provide a high contrast between the black background and the outline of the cells which are marked by the F-ACT staining. Scale bar: 5 µm. The amount of ATG5 is increased after transfection with a plasmid expressing GLI1 in wild-type MEFs, while the amount of ATG5 remains unaltered after GLI1 overexpression in Rpgrip1l-deficient MEFs. (J) BBS4 staining of wild-type and Rpgrip1l-deficient MEFs after transfection with a plasmid expressing GLI1. Cilia were marked with Ac-TUBA (red), BBS4 was stained in blue (n = 3). Scale bar: 1 µm. The amount of BBS4 is increased after GLI1 overexpression in wild-type MEFs, while the amount of BBS4 remains unaltered after GLI1 transfection in Rpgrip1l-deficient MEFs. (C to J) Asterisks indicate statistically significant differences. (I and J) The most important significant differences are written in bold.
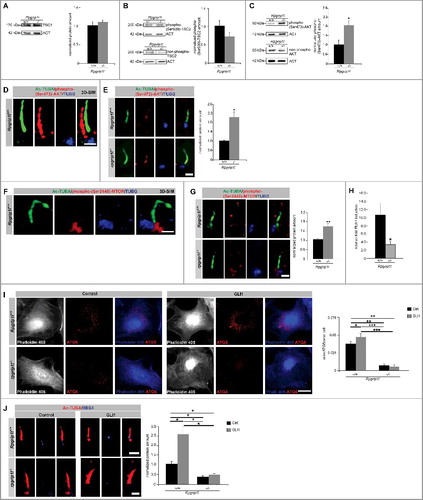
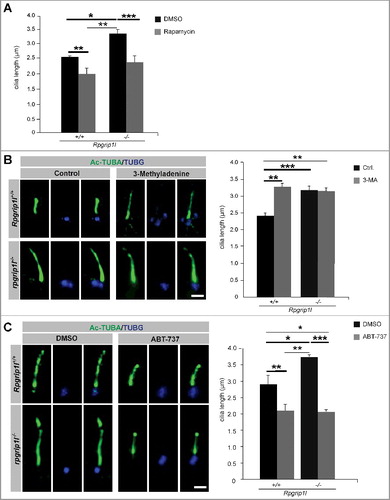
Figure 4. Pharmacological treatments rescue autophagic activity and ciliary length in the absence of RPGRIP1L. (A to C) Immunofluorescence-based cilia length quantifications. (A) Measurement of ciliary length after rapamycin treatment. The ciliary length in wild-type and Rpgrip1l-deficient MEFs is decreased after application of rapamycin (n = 3). (B) Application of the autophagy inhibitor 3-MA lengthens cilia in wild-type MEFs, but not Rpgrip1l-deficient MEFs. The ciliary axoneme is marked by Ac-TUBA (green), the basal body by TUBG (blue) (n = 4 for wild-type; n = 5 for rpgrip1l−/− MEFs). Scale bar: 1 µm. (C) Application of the autophagy activator ABT-737 decreases ciliary length in wild-type and Rpgrip1l-deficient MEFs. The ciliary axoneme is stained with Ac-TUBA (green), the basal body with TUBG (blue) (n = 4 for wild-type; n = 5 for Rpgrip1l−/− MEFs). Scale bar: 1 µm. Asterisks indicate statistically significant differences. The most important significant differences are written in bold. (A and C) Cells were treated with DMSO as a vehicle control.