
Figures & data
Figure 1. APP-PSEN1 mice overexpressing SREBF2 show an early accumulation of autophagosomes associated with decreased levels of BECN1 and impaired SQSTM1 clearance. Equal amounts of lysates from ML fractions (for LC3 analysis) or brain homogenates were subjected to SDS-PAGE and western blot analysis with the corresponding antibodies. (A) Representative immunoblots showing levels of lipidated LC3B (LC3B-II), BECN1 and SQSTM1 in brains from 10-mo-old WT mice and APP-PSEN1 mice at the indicated ages (mth, month). (B) Representative photomicrographs of hippocampus from 7-mo-old mice labeled with anti-LC3B and counterstained with DRAQ5 (blue) showing increased presence of LC3B puncta in APP-PSEN1-SREBF2 mice. Scale bar: 50 µm. Graph depicts quantification of the average number of LC3B puncta per cell (40 to 50 cells analyzed per genotype from a pool of at least 4 images). (C and D) Immunoblots of lipidated LC3B (LC3B-II), BECN1, SQSTM1, and PARK2 in soluble (sol., detergent-treated) and insoluble (insol., urea-treated) protein fractions of brains from 7-mo-old mice (C), and from mice at the indicated ages (mth, month) (D). (E) Western blot analysis of lipidated LC3B (LC3B-II), BECN1, and SQSTM1 in brains from 15-mo-old WT and APP-PSEN1 mice. In western blot analyses, densitometric values of the bands representing the specific protein immunoreactivity were normalized with the values of the corresponding ACTB/actin β bands and expressed as relative intensity values. *P< 0.05 and **P< 0.01; n≥3. See Figure S15 for uncropped blots.
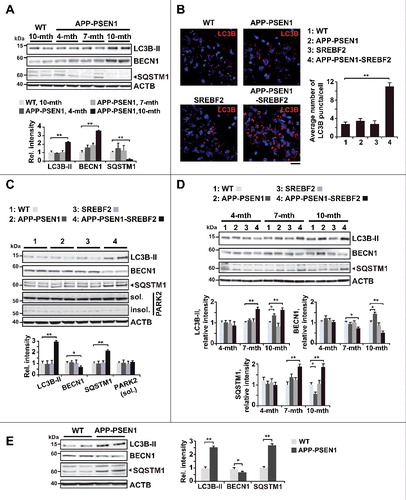
Figure 2. Expression levels of the ATG12–ATG5 ubiquitin-like conjugation system and activity of the MTOR-dependent pathway remained unchanged in APP-PSEN1-SREBF2 mice. (A) mRNA levels of the indicated autophagy-related proteins in brains from 7-mo-old WT and mutant mice analyzed by qRT-PCR. Absolute mRNA values were determined, normalized to Rn18s ribosomal RNA, and reported as relative levels referred to the expression in WT mice. (B) Protein expression levels were assessed in brain homogenates from 7-mo-old WT and mutant mice. Shown are representative immunoblots for ATG12–ATG5 conjugate, ATG7, and ATG5. (C) Western blot analysis of AMPK-dependent phosphorylation of ULK1 at Ser317. Cellular lysates from SH-SY5Y cells starved in FBS-depleted medium for 24 h were used as positive control (SC). (D) Representative immunoblots showing the MTOR-dependent phosphorylation status of RPS6KB1. In western blot analyses, densitometric values of the bands representing the specific protein immunoreactivity were normalized to the values of the corresponding ACTB bands and expressed as relative intensity values. n=3.
Figure 3. Impaired autophagic flux in SREBF2 mice after in vivo treatment with rapamycin. 7-mo-old WT and SREBF2 mice were treated with the MTOR inhibitor rapamycin (RM) at 5 mg/kg for 24 h. Equal amounts of lysates from ML fractions (for LC3 analysis) or brain homogenates were subjected to SDS-PAGE and western blot analysis with the corresponding antibodies. (A) Representative immunoblots showing levels of lipidated LC3B (LC3B-II). (B) Representative photomicrographs of hippocampus from WT and SREBF2 mice labeled with anti-LC3B and counterstained with DRAQ5 (blue). Scale bar: 50 μm. Graph depicts quantification of the average number of LC3B puncta per cell (80 to 90 cells analyzed per genotype and experimental condition from a pool of at least 4 images). (C and D) Western blot analysis of BECN1 (C), and SQSTM1 (D). (E) Representative photomicrographs of hippocampus from WT and SREBF2 mice labeled with anti-SQSTM1 and counterstained with DRAQ5 (blue). Scale bar: 50 μm. Graph depicts quantification of the average number of SQSTM1 puncta per cell (80 to 90 cells analyzed per genotype and experimental condition from a pool of at least 4 images). (F) To assess changes in autophagic flux mice were cotreated with rapamycin (RM, 5 mg/kg) and chloroquine (CQ, 50 mg/kg) for the indicated times. A representative western blot for LC3B and the corresponding quantification of the LC3B-II:LC3B-I ratio in total brain homogenates are shown. In all western blot analyses, densitometric values of the bands representing the specific protein immunoreactivity were normalized with the values of the corresponding ACTB bands and expressed as relative intensity values. **P< 0.01; n≥3. See Figure S16 for uncropped blots.
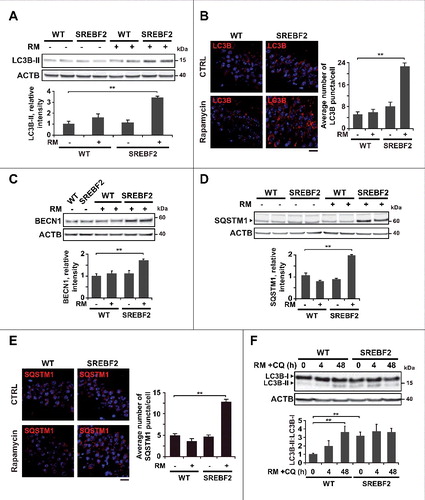
Figure 4. SREBF2 overexpression enhances autophagosome accumulation but inhibits autophagy clearance. (A and B) Embryonic cortical and hippocampal neurons isolated from WT and SREBF2 mice were treated with 10 nM rapamycin (RM) or 5 μM Aβ for 24 h. Shown are representative confocal images of neuronal-enriched cultures double immunostained for LC3B (red) and LAMP2 (green) (A) and for SQSTM1 (red) and LAMP2 (green) (B). Insets show a 3-fold magnification of the indicated region. (C) Neurons were pretreated with 5 μM wortmannin or 0.5 mM GSHee for 30 min prior autophagy induction with 5 μM Aβ for 24 h. Shown are representative confocal images of double immunolabeling with antibodies against to LC3B (red) and LAMP2 (green). Nuclei were stained by DRAQ5 (blue fluorescence). Scale bars: 50 μm. Quantification of the average number of LC3B or SQSTM1 puncta per cell was assessed using ImageJ software and depicted in the corresponding graphs (15 to 20 cells analyzed per genotype and experimental condition from a pool of at least 4 images). The Pearson correlation coefficient was used as a measure of colocalization of Alexa fluor 488 signals (LC3B) with Alexa fluor 555 signals (LAMP2). **P< 0.01.
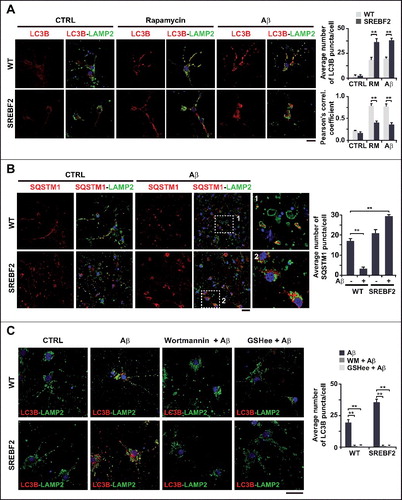
Figure 5. Mitochondrial GSH depletion in APP-PSEN1-SREBF2 mice stimulates autophagosome formation via enhancing the inhibitory effect of Aβ on ATG4B. WT and APP-PSEN1-SREBF2 mice (7-mo-old) were treated with GSHee at 1.25 mmol/kg/d every 12 h for 2 wk. Lysates from ML fractions (for LC3 analysis) or brain homogenates were subjected to western blot analysis. (A) Representative immunoblots showing levels of lipidated LC3B (LC3B-II) and SQSTM1. (B) Representative photomicrographs of hippocampal sections labeled with anti-LC3B and counterstained with DRAQ5 (blue). Scale bar: 50 μm. Graph depicts quantification of the average number of LC3B puncta per cell measured using ImageJ software (80 to 90 cells analyzed per genotype and experimental condition from a pool of at least 4 images). (C) ATG4B activity of brain homogenates from 7-mo-old WT and mutant mice. Lysates were incubated with recombinant HA-GABARAPL2 AMC at 37ºC for 45 min and ATG4B activity was assessed by means of AMC fluorescence. (D) Western blot analysis of ATG4B expression in brain homogenates from 7-mo-old WT and mutant mice. (E) ATG4B activity of neuronal-enriched cultures incubated with 5 μM Aβ for 24 h with or without 30 min preincubation with 2 mM GSHee. Cell lysates were incubated with HA-GABARAPL2 AMC as in C and AMC fluorescence was analyzed. DTT (1 mM) was added to the reaction buffer to assess ATG4B maximum activity. In western blot analyses densitometric values of the bands representing the specific protein immunoreactivity were normalized with the values of the corresponding ACTB bands and expressed as relative intensity values. *P< 0.05 and **P< 0.01; n=3. See Figure S17 for uncropped blots.
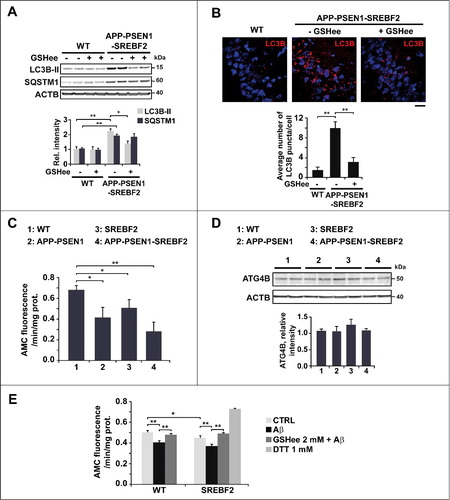
Figure 6. SREBF2 overexpression in APP-PSEN1 mice results in intracellular Aβ accumulation associated with stimulated Aβ secretion. (A and B) Quantitative assessment of extracellular Aβ secretion analyzed in medium conditioned for 48 h of neuronal-enriched cultures isolated from APP-PSEN1 and APP-PSEN1-SREBF2 mice, untreated (A) and treated with 0.2 μM wortmannin (WM) or 4 mM GSHee and expressed as percentage of untreated controls (B). *P< 0.05; n=3. (C and D) Confocal colocalization analysis of Aβ and LC3B (C) or Aβ and LAMP2 (D) in hippocampal slices from 7-mo-old APP-PSEN1 and APP-PSEN1-SREBF2 mice with or without in vivo GSHee treatment. Insets show a 3-fold magnification of the indicated region. Graphs represent fluorescence intensity profiles of Aβ (green) and LC3B or LAMP2 (red) in the regions delineated by a white line. Nuclei were stained with DRAQ5 (blue). Scale bar: 50 μm.
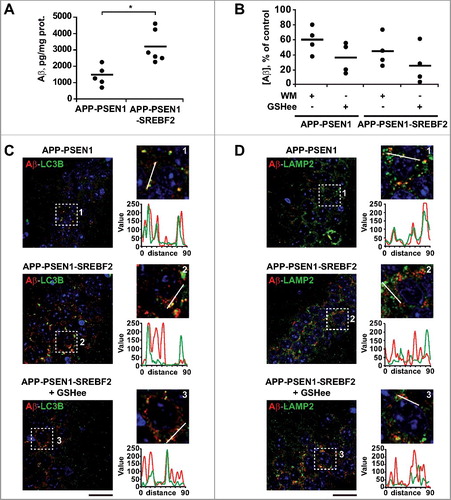
Figure 7. APP-PSEN1-SREBF2 mice show an enlarged endosomal-lysosomal system with high cholesterol levels but preserved functionality. (A) Expression levels of the indicated proteins in brain homogenates from 7-mo-old WT and mutant mice. Densitometric values of the bands representing specific protein immunoreactivity were normalized with the values of the corresponding ACTB bands and expressed as relative intensity values. *P < 0.05 and **P < 0.01; n = 3. (B) Cholesterol levels of endosomes-lysosomes isolated from brain homogenates of the indicated mice at 7 mo of age and expressed as μg of product per ACP (acid phosphatase) activity. *P< 0.05; n=3. (C and D) Hippocampal slices from 7-mo-old WT and transgenic mice. Shown are confocal photomicrographs of CTSD and LAMP2 immunoreactivity (C) or IGF2R and LAMP2 immunoreactivity (D). Scale bar: 50 μm. (G) Embryonic cortical and hyppocampal neurons isolated from WT and APP-PSEN1-SREBF2 mice. Shown are representative confocal images of double immunolabeling with antibodies against LAMP2 (green) and CTSD (red) or IGF2R (red), as indicated. Nuclei were stained with DRAQ5 (blue). Scale bar: 50 μm. The Pearson correlation coefficient was calculated in all the confocal microscopy analysis for quantifying colocalization (15 to 20 cells were analyzed per genotype and experimental condition from a pool of at least 3 images).
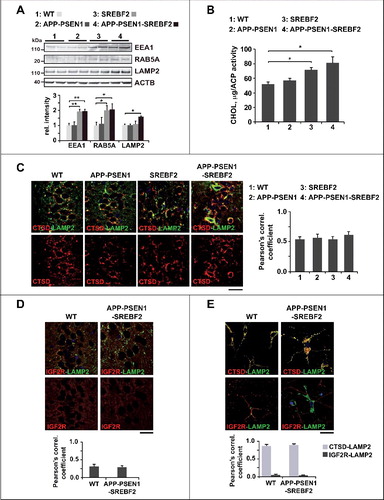
Figure 8. APP-PSEN1 mice overexpressing SREBF2 show impaired autophagosome and endosome-lysosome fusion associated with an accumulation of Aβ and endogenous MAPT in autophagosomes. (A) Autophagosomes (F1) immunolabeled with anti-LC3B antibody and lysosomes (F3) stained with LysoTracker Red were incubated together and fusion events were monitored by immunofluorescence microscopy. Insets show a 3-fold magnification. In inset 2, differentially labeled vesicles in close proximity are indicated by white arrows. Scale bar: 50 μm. (B) Expression levels of Aβ and MAPT in autophagosomes (AP) and endosomes-lysosomes (EL). LC3B and CTSD (intermediate, 45 kDa; and mature form, 34 kDa) were used as markers of AP and lysosomes, respectively. All densitometric values were first normalized to Ponceau S staining to adjust for protein loading. MAPT values were normalized to the corresponding LC3B (I and II) and CTSD (mature form) bands. *P< 0.05 and **P< 0.01; n=3. (C) Proteinase K protection assay. Autophagosomes from APP-PSEN1-SREBF2 mice were exposed to proteinase K (Prot K) with or without Triton X-100 for 30 min. After inhibition of protease activity, levels of Aβ were quantified. To evaluate the presence of Aβ aggregates the same autophagosomal fraction was incubated with HFIP. Disruption of the aggregated forms significantly increased Aβ values, presumably by favoring antibody recognition. *P< 0.05 and **P< 0.01; n=3.
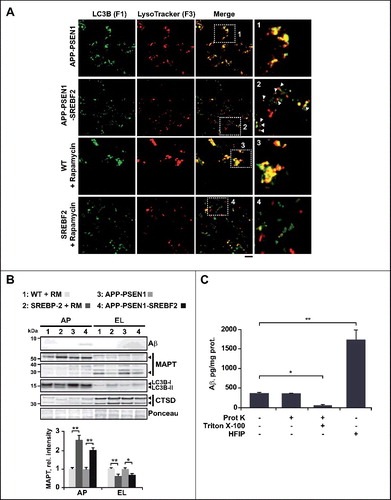
Table 1. Decreased fusion of autophagosomes with endosomes-lysosomes isolated from APP-PSEN1-SREBF2 mice compared to APP-PSEN1 mice.
Table 2. Decreased fusion of autophagosomes with endosomes-lysosomes isolated from SREBF2 mice compared to WT mice.
Figure 9. Changes in levels and membrane distribution of key autophagosome and endosome-lysosome fusion proteins in mice overexpressing SREBF2 are prevented by in vivo treatment with 2-hydroxypropyl-β-cyclodextrin resulting in improved MAPT and Aβ clearance. (A) Western blot analysis of the indicated proteins in endosomes-lysosomes isolated from 7-mo-old WT and transgenic mice. (B) Immunoblot analysis of VAMP7 and VTI1B distribution into soluble fractions and DRMs isolated from endosomes-lysosomes of 7-mo-old WT and the indicated transgenic mice. Immunoblots with FLOT1 identified DRMs mainly in fractions 1 and 2. Int-I and Int-II: intermediate fraction I and II, Sol.: soluble fraction. (C) Expression levels of ATG14 and STX17 in autophagosomes isolated from 7-mo-old WT and the indicated mutant mice. To induce autophagy WT and SREBF2 mice were treated with rapamycin (RM, 5 mg/kg) for 24 h. LC3B protein levels were analyzed as a marker of autophagosomes. ATG14 and STX17 were normalized to the corresponding LC3B (I and II) bands. (D to H) Mice were treatment with HP-β-CD (4 g/kg) for 10 wk. To induce autophagy WT and SREBF2 mice were treated with rapamycin (RM, 5 mg/kg) 24 h prior sacrifice. (D) Expression levels of RAB7A and the indicated SNARE proteins in endosomes-lysosomes. LAMP1 was used as a marker of lysosomes. Densitometric values of the bands representing the specific protein immunoreactivity were normalized with the values of the corresponding LAMP1 bands. (E) Immunoblot analysis of VAMP7 and VTI1B distribution into soluble fractions and DRMs isolated from endosomes-lysosomes (EL). Immunoblots with FLOT1 identified DRMs mainly in fractions 1 and 2. Int-I and Int-II: intermediate fractions I and II, Sol.: soluble fraction. (F) Expression levels of ATG14 and STX17 in autophagosomes. LC3B was used as a marker of autophagosomes. ATG14 and STX17 were normalized to the corresponding LC3B (I and II) bands. (G) Expression levels of endogenous MAPT in autophagosomes (AP) and endosomes-lysosomes (EL). LC3B and CTSD (intermediate, 45 kDa; and mature form, 34 kDa) levels were used as autophagosome and lysosome markers, respectively. MAPT values were normalized to the corresponding LC3B (I and II) and CTSD (mature form) bands. (H) Representative immunoblot showing that HP-β-CD treatment prevents the accumulation of Aβ in autophagosomes isolated from APP-PSEN1-SREBF2 mice. In all western blots, densitometric values of the bands representing specific protein immunoreactivity were first normalized to Ponceau S staining to adjust for protein loading. *P< 0.05 and **P< 0.01; n=3. See Figure S18 for uncropped blots.
Table 3. In vivo treatment with 2-hydroxypropyl-β-cyclodextrin (HP-β-CD) recovers the fusogenic properties of autophagic vesicles isolated from SREBF2 mice.
Figure 10. Schema illustrating our proposed model by which high cholesterol levels regulate Aβ-induced autophagy. In mitochondria (A), cholesterol-enrichment enhances ROS generation triggered by Aβ. The increased oxidative stress inhibits the delipidation activity of ATG4B on LC3B, and therefore, favors autophagosome synthesis. ER-mitochondria contact sites contribute to the biogenesis of these vesicles, which mainly enclose Aβ aggregates together with other more soluble forms of the peptide. In contrast, the accumulation of cholesterol in lysosomes (B) affects the levels and distribution of RAB7A and SNARE proteins, which ultimately impairs the ability of lysosomes to fuse with autophagosomes and/or amphisomes. Inhibition of the autophagy flux by high cholesterol levels reduces MAPT and Aβ clearance and stimulates Aβ secretion. DRMs, detergent-resistant membranes; mGSH, mitochondrial glutathione; LE, late endosome; MVB, multivesicular body; ROS, reactive oxygen species.
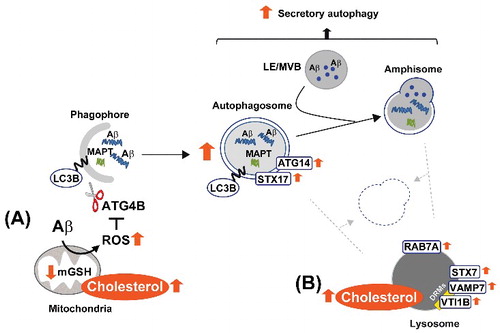
Table 4. Details of the primary antibodies used in the current study.
Table 5. Primer sequences used for qRT-PCR.