Figures & data
Figure 1. Generation of ATG5i mice. (a) Graphical illustration of doxycycline (dox)-inducible Atg5-RNAi (ATG5i) system. Only through crossing with the appropriate Cre-expressing strain is the loxP-STOP-loxP (LSL) cassette excised and rtTA3 protein produced. In the presence of dox, rtTA3 is able to bind to the tet-responsive element (TRE) and drive the expression of Atg5-shRNA in a miR-E backbone. IRES, Internal Ribosome Entry Site; mKate2, far-red fluorescent protein (Evrogen). (b) Western blots for the indicated proteins in MEFs isolated from ATG5i mice and littermate controls in the presence or absence of dox (3 days). Control littermates lack either the rtTA3 or shAtg5 cassette. (c-h) Eight-week-old ATG5i mice fed on a dox-containing diet for 6 weeks display a decrease in (c) weight (males, P = 0.0017 n = 16 control and ATG5i; females, P = 0.0239 n = 16 control and 9 ATG5i mice), (d) reduction in inguinal fat weight (P = 0.0286, n = 4 males per condition), (e) reduction in muscle weight (P = 0.0286, n = 4 males per condition), (f) hepatomegaly (P = 0.0006, n = 7; 3 females and 4 males per condition), (g) splenomegaly (P = 0.0286 n = 4 males per condition), and (h) seminal vesicle atrophy (P = 0.0022 n = 6 males per condition). All pairwise comparisons determined using Mann-Whitney test (*P < 0.05, **P < 0.01 and ***P < 0.001). Error bars represent s.d. around the means.
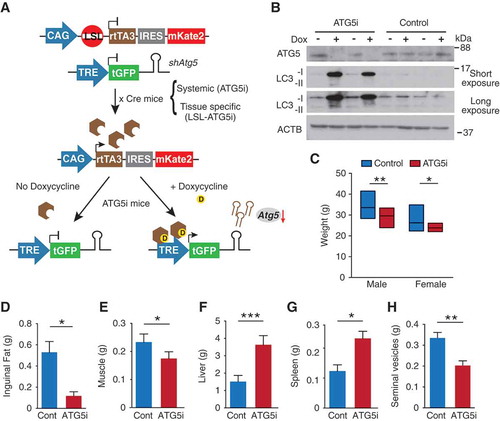
Figure 2. In vivo validation of autophagy inhibition upon Atg5 downregulation. (a) ATG5 shows by western blot a downregulation across a range of tissue in adult mice treated with dox for 6 weeks, except the brain, which displays no alterations in ATG5 in whole tissue extracts. ACTB serves as a loading control in all tissues except for heart and muscle for which total actin was used instead. (b) ATG5i mice display an increase in SQSTM1 in the indicated tissues via IHC. (c) Atg5 downregulation is associated with the development of large proteinaceous aggregates in the liver (yellow arrows). Additionally, cellular degeneration of the exocrine and endocrine pancreas is visible by H&E analysis (yellow asterisk). Scale bars: 100 μm in b and c.
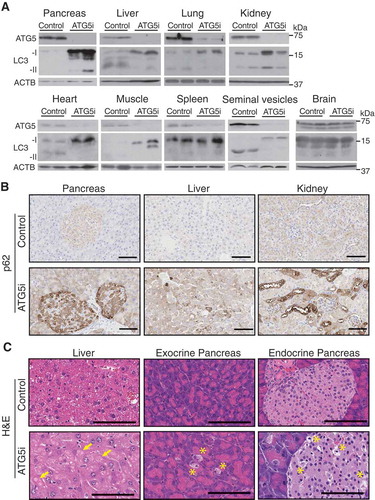
Figure 3. Perinatal survival of ATG5i neonates. (a) Breeding strategy for the generation of ATG5i neonates. A doxycycline-containing diet was fed to the parents who each have 1 component of the 2-component system, and thus are unable to induce Atg5-shRNA. Any embryos with both components, however, will induce the system. Cont, control. (b) IHC analysis of 14-day-old neonates highlights the presence of SQSTM1 aggregates in the livers of ATG5i mice in comparison to control. Scale bars: 100 μm. (c) ATG5i neonates are born at, and survive at, expected Mendelian ratios. They appear indistinguishable from their littermate controls except for their positivity for tGFP (bottom). (d) While initially indistinguishable, ATG5i mice do not show the same growth kinetics (n = 6 males in both conditions).
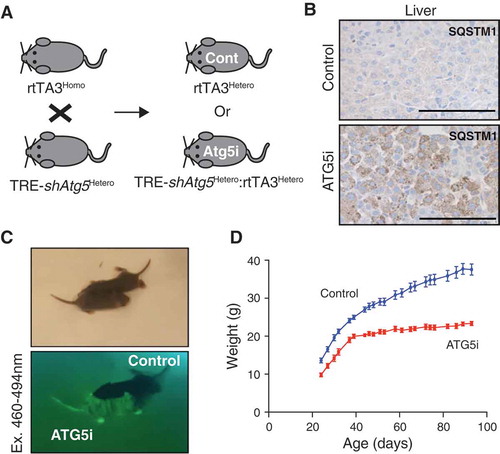
Figure 4. Adult ATG5i mice survive starvation-induced stress and maintain glucose homeostasis. (a) ATG5i mice administered dox for 2 weeks and having food withdrawn for 24 h prior to sacrifice display downregulation of ATG5 and a reduction of LC3-I to LC3-II conversion in the liver. (b) These same livers also show the formation of SQSTM1 aggregates as seen through immunohistochemical analysis. Scale bars: 100 μm. (c) These mice show no evidence of starvation-induced mortality when food is removed for 24 h (control, n = 6; ATG5i, n = 4). (d) Blood glucose levels before and after food withdrawal show no significant difference between control and experimental (free feeding P = 0.66; starved P = 0.37, Mann Whitney). N.S., not significant.
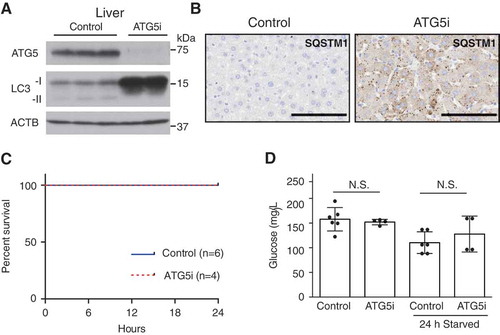
Figure 5. Restoration of ATG5 is associated with reversal of hepatomegaly. (a) Consistent with the results in ), adult mice treated with dox for 6 weeks develop hepatomegaly in comparison to control mice (P = 0.0035). However, the restoration of ATG5 levels in ATG5i mice is associated with a significant reduction in liver size (P = 0.007) to a weight similar to control mice on the same feeding regimen. (n = 8–10 mice per group; Kruskal-Wallis with Dunn’s post test, **P < 0.01, N.S., not significant) (b) Example images of an MRI scan from ATG5i mice at the 6-week on dox time point, as well as the 6-week on dox -> 6-week off dox time point displaying hepatomegaly and reversal to normal size, respectively. Yellow dotted lines encircle livers. (c) Time series analyses of liver size after dox addition, followed by dox withdrawal using MRI (n = 2 mice per condition, average value is shown; see Figure S5B for individual data). (d) Adult ATG5i mice fed on a dox-containing diet for 6 weeks display a downregulation of ATG5 and an increase in LC3-I by western blot analysis. When switched back to a normal diet for 6 weeks mice show a recovery in ATG5 levels and LC3-I, similar to control mice.
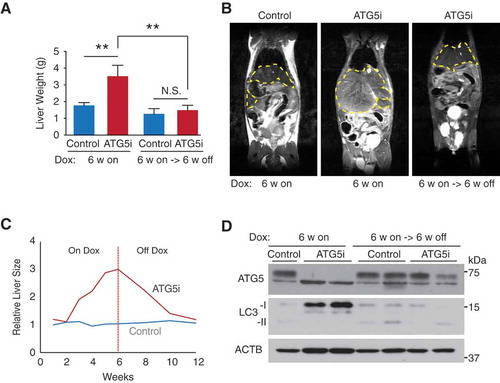
Figure 6. Restoration of ATG5 is associated with the induction of hepatic fibrosis. (a) Representative histology and IHC from the livers of control and ATG5i mice. Yellow arrows highlight large intracellular inclusions only found in ATG5i mice on dox. Scale bars: 100 μm. (b) Representative images of picrosirius red staining in sections of control and ATG5i mice in the indicated conditions. Scale bars: 100 μm. (c) Only ATG5i mice treated with dox for 6 weeks and off dox for 6 weeks showed the presence of fibrosis (P = 0.0468 Welch’s t-test, error bars represent s.d. around the means). **P < 0.01; N.S., not significant. Control (cont). (d) Immunohistochemical analysis of livers from each time point highlights that ACTA2/α-SMA-positive activated stellate cells are only present during the 6-week on dox time point, with staining positivity only present in the 6-week on dox->6-week off dox time point. (e) Whole tissue protein extracts display a similar trend with COL1A1 present only in the ATG5i mice at the 6-week on dox -> 6-week off dox time point.
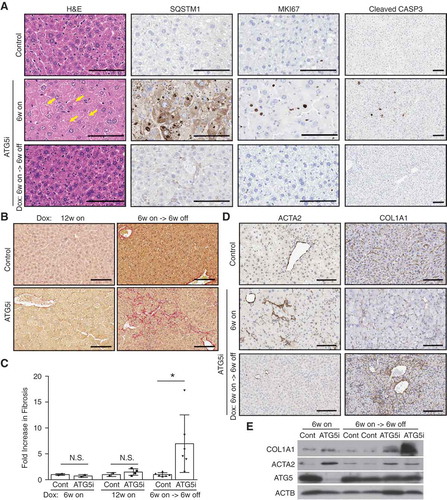
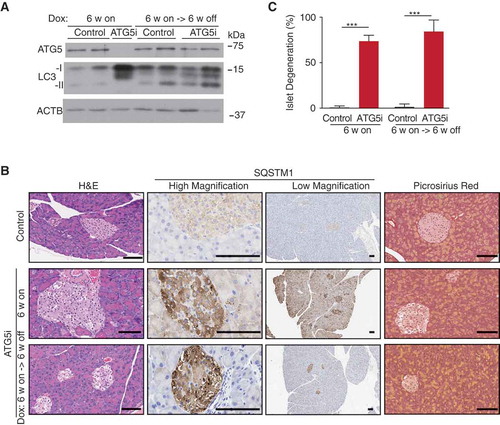
Figure 7. ATG5 restoration in the pancreas leads to partial phenotypic rescue. (a) Adult ATG5i fed on a dox-containing diet for 6 weeks display a downregulation of ATG5 and an increase in LC3-I by western blot analysis. When returned to a normal diet for 6 weeks mice show a recovery in ATG5 and LC3-I levels, similar to those seen in control mice. (b) Representative histology, IHC, and picrosirius red staining (marker of fibrosis) from the pancreas of control and ATG5i mice. Whereas SQSTM1 levels are increased in both the islets and acinar of ATG5i mice on dox, only the acinar display a reversal once dox is removed. Islets do not show a reversal of the degeneration phenotype as viewed by H&E. Scale bars: 100 μm. (c) Dox-treated adult mice display evidence of islet degeneration that is not reversed upon dox withdrawal. Mann-Whitney test, ***P < 0.001.