Figures & data
Table 1. Hydrodynamic size and zeta potential of the SiNPs in dispersion media.
Figure 1. Characterization of SiNPs. (a) TEM analysis shows SiNPs exhibit near-spherical shape and good dispersibility. Scale bar: 100 nm. (b) Size-distribution histograms were obtained using ImageJ software. The average SiNP diameter was 57.74 ± 7.35 nm. (c) The hydrodynamic sizes and (d) zeta potential of SiNPs in distilled water.
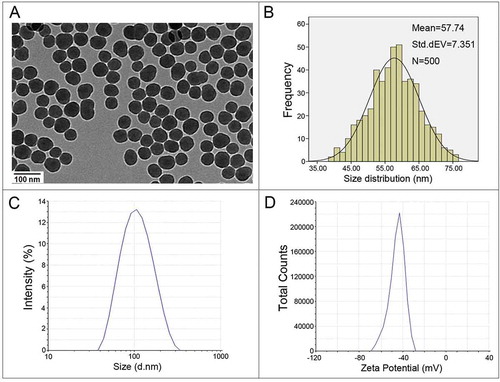
Figure 2. Cellular uptake and cytotoxicity of the SiNPs in the L-02 cells. (a) LSCM images of the L-02 cells with 25 μg/ml and 50 μg/ml red fluorescence-labeled SiNPs treatment for 24 h. Cells were fixed and assessed by staining the cytoskeleton with Acti-stain™488 phalloidin (green) and nuclei with DAPI (blue).Scale bar: 25 µm (b) TEM images of the L-02 cells with 25 μg/ml SiNPs treatment for 24 h. No SiNPs were observed in the control group and the subcellular structures were normal. Electron-dense SiNPs were dispersed in the cytoplasm, lysosomes, and autolysosomes in the SiNP-treated cells. The magnification view of the selected area shows lysosomes (blue arrows), autolysosomes (red arrows) containing aggregated SiNPs. N, nucleus; LY, lysosome; and AL, autolysosome. Scale bars: 1 μm and 5 μm. (c) Cytotoxicity was analyzed by a CCK-8 kit. The L-02 cells were treated with different doses of SiNPs (6.25, 12.5, 25, 50, and 100 μg/ml) for 12 h and 24 h. Data are expressed as mean ± SD. ··· p · 0.05 versus the control.
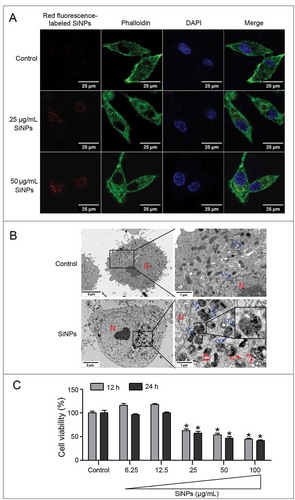
Figure 3. SiNPs activate autophagy and enhance autophagosome accumulation in the L-02 cells. (a) TEM images show that the autophagosomes accumulated in the L-02 cells with 25 μg/ml SiNPs treatment for 24 h. Red arrow, double-membrane autophagosome or single-membrane autolysosome. N, nucleus.Scale bars, 0.2 μm and 1 μm. (b) LSCM images of indirect immunofluorescence analysis show the LC3B distribution patterns in the control and SiNP-treated cells. LC3B (green) and DAPI staining of nuclei (blue) is shown. Scale bar: 25 μm. The number of punctate LC3B per cell in the untreated control and SiNP-treated cells is shown. Data are expressed as mean ± SD. *· p · 0.05 versus the control. (c) The L-02 cells were treated with 12.5, 25, and 50 μg/ml of SiNPs for 24 h. (d) The L-02 cells were pretreated with (+) or without (–) 10 nM BafA1 for 2 h, then the cells were treated with 12.5, 25, and 50 μg/ml of SiNPs for another 24 h. Thereafter, (c) and (d) cells were harvested and the expressions of LC3B and SQSTM1 were analyzed by western blot. Blots are representative of 3 independent experiments. ACTB was used as the sample-loading control. Densitometric LC3B-II:ACTB and SQSTM1:ACTB ratios from at least 3 independent experiments are shown. The value of the control without any treatment was set at 1 for each experiment (*, p < 0.05; N.S., not significant).
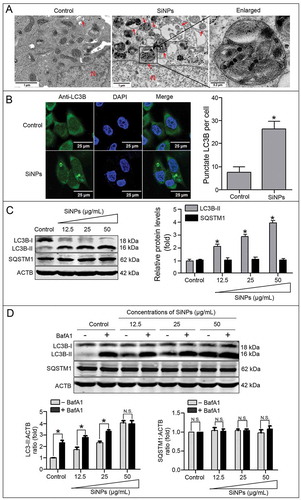
Figure 4. SiNPs induce ER stress via selectively activating the EIF2AK3 and ATF6 pathways. (a) LSCM images indicate that SiNPs were localized in the ER lumen. The L-02 cells were treated with 50 μg/ml red fluorescence-labeled SiNPs for 24 h. Thereafter, the living cells were stained with 1 μM of ER-Tracker Green probes at 37°C for 30 min, then the cells were stained with 20 ng/ml of Hoechst 33,342 at 37°C for another 30 min, and they were finally imaged by LSCM. SiNPs (red), ER-Tracker Green probes (green), and Hoechst 33,342 staining of the nuclei (blue) are shown. Scale bar: 10 μm. (b) TEM images of the L-02 cells with 25 μg/ml SiNP treatment for 24 h showed that the SiNPs caused ER ultrastructure damage and degranulation of rough ER. Red arrow, ER. N, nucleus. Scale bar: 0.2 μm. (c) SiNPs activated the EIF2AK3 and ATF6 pathways. The L-02 cells were treated with 6.25, 12.5, 25, 50, and 100 μg/ml of SiNPs for 24 h. Thereafter, the cells were harvested and the expression of HSPA5, EIF2AK3 (p-Thr980), EIF2AK3, EIF2S1 (p-Ser51), EIF2S1, ATF6, ATF4, and DDIT3 were analyzed by western blot using the indicated antibodies. Blots are representative of 3 independent experiments. ACTB was used as a sample-loading control. Densitometric HSPA5:ACTB, ATF4:ACTB, and DDIT3:ACTB ratios from at least 3 independent experiments are shown. The value of control without any treatment was set at 1 for each experiment (*, p < 0.05). (d) Frame diagrams of XBP1 mRNA splicing. XBP1 mRNA splicing involves cleavage of a 26-bp fragment containing the PstI site and shifting of the open reading frame (ORF), thus the spliced XBP1 does not contain the PstI site. (e) SiNPs did not activate the ERN1-XBP1 pathway of the UPR. The L-02 cells were treated with 12.5, 25, and 50 μg/ml of SiNPs for 24 h. Thereafter, the cells were harvested and RT-PCR was performed using XBP1-specific primers, and the PCR products were digested by PstI. The unsplicedXBP1 products were digested into 295-bp and 147-bp fragments in both the control andSiNP-treated groups, while the 416-bp spliced XBP1 products could not be digested by PstI in the positive thapsigargin (Tg)-treated group. XBP1(u): unspliced XBP1; XBP1(s): spliced XBP1. ACTB was used as the loading control.
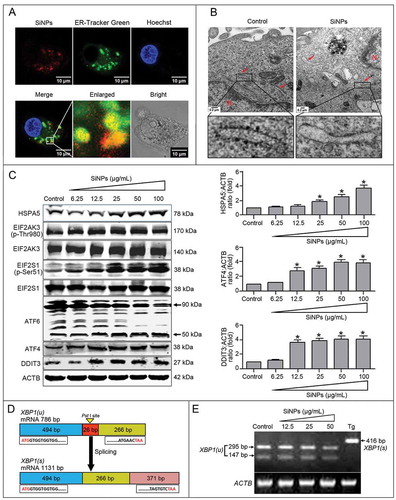
Figure 5. 4-phenylbutyric acid (4-PBA) inhibits SiNP-induced ER stress and autophagy. (a, b) L-02 cells incubated with 25 μg/ml SiNPs were treated with (+) or without (–) 5 mM 4-PBA (ER stress inhibitor) for 12 h before harvesting at 24 h. The L-02 cells that were treated with 300 nM thapsigargin (Tg, a chemical known to rapidly elicit ER stress) for 12 h were used as the positive control. Thereafter, the cells were harvested and the expressions of HSPA5, ATF4, DDIT3, LC3B, and SQSTM1 were analyzed by western blot using the indicated antibodies. Blots are representative of 3 independent experiments. ACTB was used as a sample-loading control. Densitometric HSPA5:ACTB, ATF4:ACTB, DDIT3:ACTB, LC3B-II;ACTB, and SQSTM1;ACTB ratios from at least 3 independent experiments are shown. The value of control without any treatment was set at 1 for each experiment (*, p < 0.05). (c) The LC3B distribution patterns in (a, b) cells were analyzed using indirect immunofluorescence with anti-LC3B antibodies and imaged by LSCM. LC3B (green) and DAPI staining of the nuclei (blue) are shown. Scale bar: 25 μm. The number of punctate LC3B per cell in the untreated control and SiNP-treated cells is shown. Data are expressed as mean ± SD. ··· p · 0.05 versus the control.
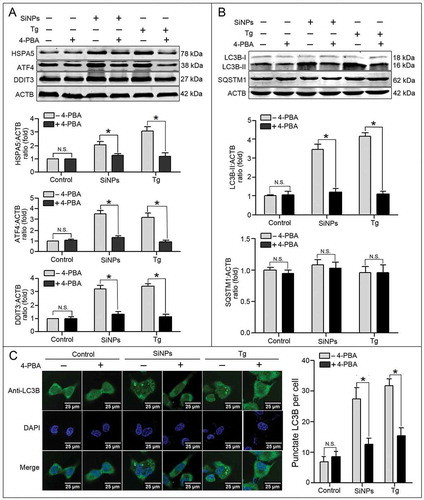
Figure 6. SiNP-induced autophagy is mediated by the EIF2AK3 and ATF6 UPR pathways. (a, b) The L-02 cells were incubated with lentiviral shRNA against EIF2AK3 (a) and ATF6 (b) (MOI = 1) for 3 h, then replaced with fresh complete media and treated with 25 μg/ml SiNPs for 24 h before harvesting at 72 h post-transduction. Thereafter, the cells were harvested and western blot was performed using the indicated antibodies. Blots are representative of 3 independent experiments. ACTB was used as the sample loading control. The densitometric EIF2AK3(p-Thr980):ACTB, ATF4:ACTB, DDIT3:ACTB, and LC3B-II:ACTB ratios from at least 3 independent experiments are shown in (a). The densitometric DDIT3:ACTB and LC3B-II:ACTB ratios from at least independent experiments are shown in (b). The value of the control cells with control shRNA was set at 1 for each experiment (*, p < 0.05; N.S., not significant). (c) The LC3B distribution patterns in (a, b) cells were analyzed using indirect immunofluorescence with anti-LC3B antibodies and imaged by LSCM. LC3B (green) and DAPI staining of the nuclei (blue) are shown. Scale bar: 25 μm. The number of punctate LC3B per cell in the untreated control and SiNP-treated cells is shown. Data are expressed as mean ± SD. ··· p · 0.05 versus the control.
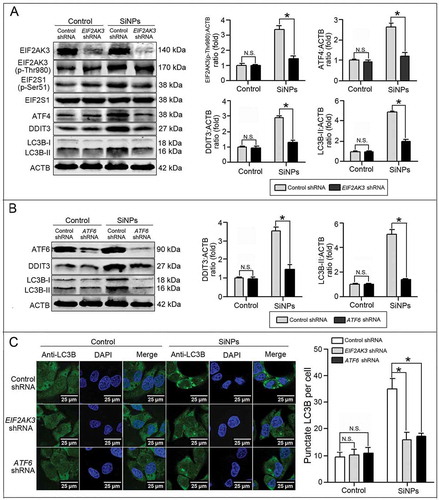
Figure 7. LC3B and ATG12 were transcriptionally upregulated by downstream ATF4 and DDIT3 in ER stress.(a, b) L-02 cells were incubated with lentiviral shRNA against ATF4 (a) and DDIT3 (b) (MOI = 1) for 3 h, then replaced with fresh complete media and treated with 25 μg/mlSiNPsfor 24 h before harvesting at 72 h post-transduction. Thereafter, the cells were harvested and western blot was performed using the indicated antibodies. Blots are representative of 3 independent experiments. ACTB was used as the sample loading control. The densitometric DDIT3:ACTB, ATG12:ACTB, ATG5:ACTB, and LC3B-II:ACTB ratios from at least 3 independent experiments are shown in (a). The densitometric DDIT3:ACTB and LC3B-II:ACTB ratios from at least 3 independent experiments are shown in (b). The value of the control cells with control shRNA was set at 1 for each experiment (*, p < 0.05). (c) The LC3B distribution patterns in (a, b) cells were analyzed using indirect immunofluorescence with anti-LC3B antibodies and imaged by LSCM. LC3B (green) and DAPI staining of the nuclei (blue) are shown. Scale bar: 25 μm. The number of punctate LC3B per cell in the untreated control and SiNP-treated cells are shown. Data are expressed as means ± SD. ··· p · 0.05 compared with the control. (d) Knockdown of ATF4 and DDIT3 inhibited LC3B and ATG12 mRNA expression. The L-02 cells were incubated with lentiviral shRNA against ATF4 and DDIT3 (MOI = 1) for 3 h, then replaced with the fresh complete media and treated with 25 μg/ml SiNPs for 24 h before harvesting at 72 h post-transduction. Thereafter, the cells were harvested and the real-time PCR assay was performed. Data are representative of 3 independent experiments (*, p < 0.05).
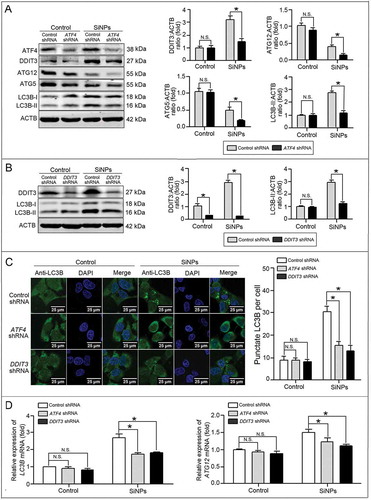
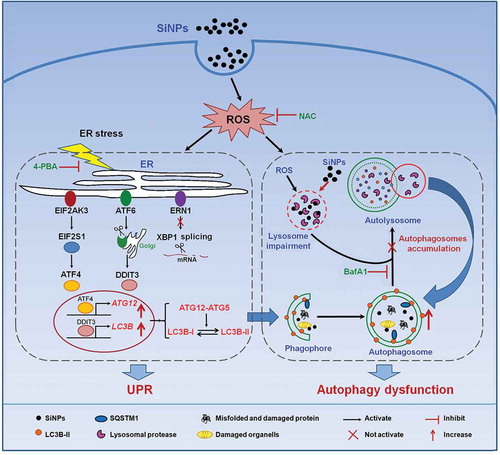
Figure 8. Schematic illustration of the proposed molecular mechanism by which SiNPs induce autophagosome accumulation and aggravate autophagy dysfunction. SiNPs were endocytosed into L-02 cells and stimulated ROS generation. The internalized SiNPs triggered ER stress through the activation of the EIF2AK3 and ATF6 pathways but not the ERN1-XBP1 pathway, along with the upregulation of ATF4 and DDIT3. Then, the 2 factors were translocated to the nucleus and increased the transcriptional expressions of 2 key autophagic genes LC3B and ATG12, contributing to autophagosome formation. Previous study has shown that the internalized SiNPs impaired the lysosomes and inhibited the degradation of the autophagosomes. Therefore, SiNPs induce the autophagosome accumulation and aggravate the autophagy dysfunction.