Figures & data
Figure 1. Stable knockdown and inhibition of ULK1 and ULK2 does not affect PV replication. (a) Stable cell lines expressing shRNA towards ULK1 were generated in HEK-293T and H1-HeLa cells. Knockdown of ULK1 was confirmed via western blot. Parental and ULK1 knockdown (ULK1 KD) HEK-293T and H1-HeLa cell lines were infected with poliovirus (PV) at an MOI = 0.1 and intracellular titers analyzed 6 hpi via plaque assay. Error bars represent standard error of the mean of n = 3 experiments. (b) Parental and ULK2 KD H1-HeLa cells were infected with PV at an MOI = 0.1 and assayed for intracellular virus via plaque assay at 0 and 6 hpi. Error bars represent standard error of the means for n = 3 experiments. (c) HEK-293T cells were transfected with siRNA towards Luciferase or ULK1 and incubated 48 h. Cells were then mock infected or infected with PV at an MOI = 50 and collected at 0, 3, or 6 hpi for western blot analysis. Densitometry of n = 3 independent experiments is provided in Figure S1A. (d) Intracellular viral titers for DMSO- and MRT68921-treated H1-HeLa cells. H1-HeLa cells were treated with DMSO or 10 µM MRT68921 for 1 h, cells were then mock infected or infected with PV at an MOI = 0.1 along with concurrent treatment with drug, and collected for plaque assay analysis. Error bars represent standard error of the mean of n = 3 independent experiments. Statistical significance was determined via a two-tailed paired Student’s t-test between DMSO and MRT68921 where * p < 0.05.
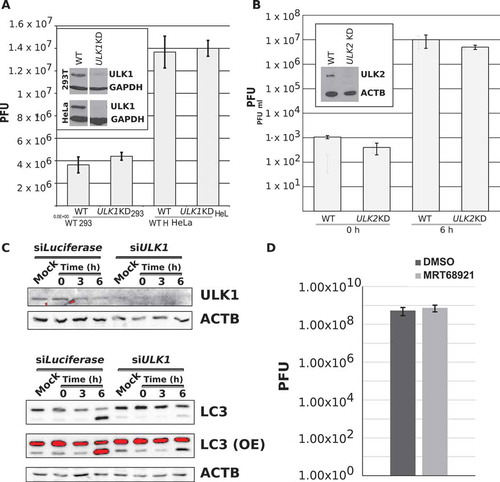
Figure 2. Knockdown of RB1CC1 inhibits basal autophagy but does not affect PV replication or autophagic signals. HEK-293T cells were transfected with siRNA towards Luciferase (siLuciferase, siLuc) or RB1CC1 (siRB1CC1, siRB1) for 48 h before being used for downstream applications. (a) Western blot and densitometry analysis of HEK-293T cells 48 h post transfection. Intensity was corrected to GAPDH. Error bars represent standard error of the mean of n = 4 independent experiments. Statistical significance was determined via a two-tailed paired Student’s t-test where * p < 0.05. (b) Western blot analysis of SQSTM1 and LC3 levels of HEK-293T cells after RB1CC1 KD. Intensity was corrected to GAPDH. Error bars represent standard error of the mean of n = 3 independent experiments. Statistical significance was determined via a two-tailed paired Student’s t-test where * p < 0.05 and ** p < 0.01. (c) Transfected HEK-293T cells were infected with PV at an MOI = 0.1 and intracellular virus titers determined via plaque assay at 0, 2, 4, and 6 hpi. Error bars represent standard error of the mean of n = 3 independent experiments. (d) Western blot analysis of LC3 levels in transfected HEK-293T cells that were mock infected with PBS+ or infected with PV at an MOI = 50. Intensity was corrected to GAPDH intensity. Statistical significance was determined via a two-tailed paired Student’s t-test where * p < 0.05.
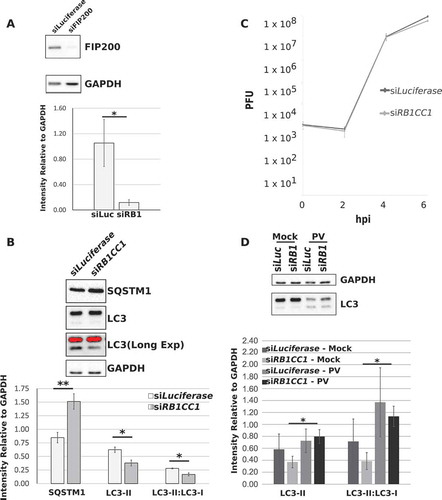
Figure 3. PV induces cellular membrane rearrangement in the absence of RB1CC1. HEK-293T cells were transfected with siRNA against Luciferase or RB1CC1 and incubated for 48 h. Cells were then collected for western blot verification of knockdown (a and b). (a) Representative western blots of RB1CC1 and SQSTM1 levels in mock- and PV-infected transfected cells. (b) Densitometry analysis of western blots from (a). Error bars represent the standard error of the mean of n = 3 independent experiments. Statistical significance was determined via a two-tailed paired Student’s t-test where * p < 0.05, ** p < 0.01, and *** p < 0.001. Concurrent transfected cells were mock infected (d and f) or infected with poliovirus (c and e) for 3.5 h before being fixed and prepared for transmission EM imaging. (c-f) Representative EM images of mock- or PV-infected transfected cells. Replicate images are supplied in Figure S3.
Figure 4. PV cleaves SQSTM1/p62. (a and b) HEK-293T cells were transfected with siRNA against Luciferase or RB1CC1 as in and then mock infected with PBS+ or PV at an MOI = 50 for 6 h. (a) Representative western blot of SQSTM1 after 6 hpi with PV. Densitometry analysis of n = 3 independent experiments is supplied in Figure S5F. (b) Representative western blot analysis of SQSTM1 levels with a longer exposure than (a). Further replicates are provided in Figure S4. (c) H1-HeLa cells were either infected with PV (MOI = 50), infected and then treated with guanidine HCl (GuHCl) (2 mM), or treated with UV-inactivated PV for the listed times. A representative western blot of ULK1, LC3, and SQSTM1 levels is shown. Densitometry analysis of n = 3 independent experiments and intracellular viral titers of PV, PV with guanidine HCl, or UV-inactivated PV are supplied in Figure S5. (c) H1-HeLa cells were treated with DMSO or 10 µM MRT68921 for 1 h, cells were then mock infected or infected with PV at an MOI = 50 along with concurrent treatment with drug, and collected for western blot analysis. Densitometry of n = 3 independent experiments is provided in Figure S1B.
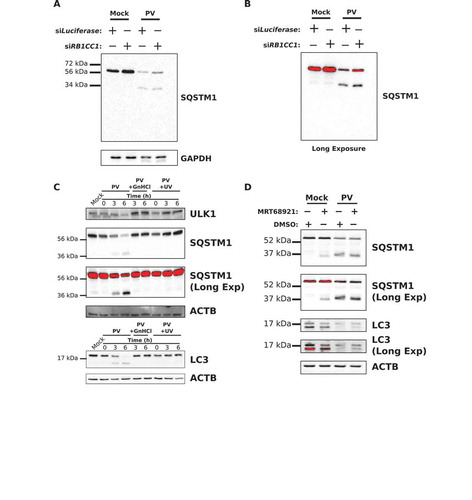
Figure 5. ULK1 levels decrease but the protein is not degraded via the proteasome during infection. (a-c) HEK-293T cells were transfected with siRNA against Luciferase, PSMG1, or PSMG2 and incubated for 48 h. Cells were then collected for qPCR analysis, or mock or PV infected (MOI = 50 or MOI = 0.1) for 6 h before collection for western blot or plaque assay analysis. (a) Western and densitometry analysis of ULK1 levels in mock- or PV-infected transfected cells. Intensity was corrected to ACTB. Error bars represent standard error of the mean of n = 3 independent experiments. Statistical significance was determined via a two-tailed paired Student’s t-test where * p < 0.05, ** p < 0.01, and *** p < 0.001. (b) Relative expression levels of PSMG1 and PSMG2 as determined via qPCR analysis. Cell counts were normalized to TFRC (transferrin receptor) levels before subsequent data analysis. Error bars represent standard error of the mean of n = 3 independent experiments. Statistical significance was determined via a two-tailed paired Student’s t-test where **** p < 0.0001. (c) Intracellular PV titers as determined via plaque assay. Error bars represent standard error of the mean of n = 3 independent experiments. Statistical significance was determined via a two-tailed paired Student’s t-test where * p < 0.05. (d) Western blot and densitometry analysis of ULK1 levels in H1-HeLa cells treated with DMSO, 100 μM cycloheximide (Chx), or infected with PV (MOI = 50) for 6 h. Intensity was corrected to ACTB. Error bars represent standard error of the mean of n = 3 independent experiments. Statistical significance was determined via a two-tailed paired Student’s t-test where * p < 0.05 and ** p < 0.01. (e) Western blot and densitometry analysis of ULK2 and SQSTM1 levels in mock- or PV-infected (MOI = 50) H1-HeLa cells for the indicated time points. Intensity was corrected to TUBA/α-tubulin. Error bars represent standard error of the mean of n = 3 independent experiments. Statistical significance was determined via a repeated measures ANOVA with a Tukey/Tukey-Kramer post-hoc test where * p < 0.05 and ** p < 0.01.
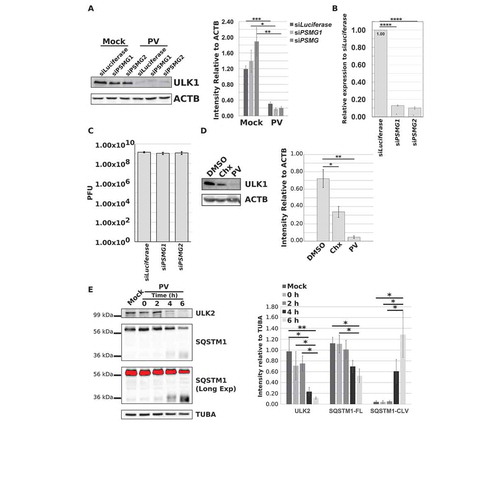
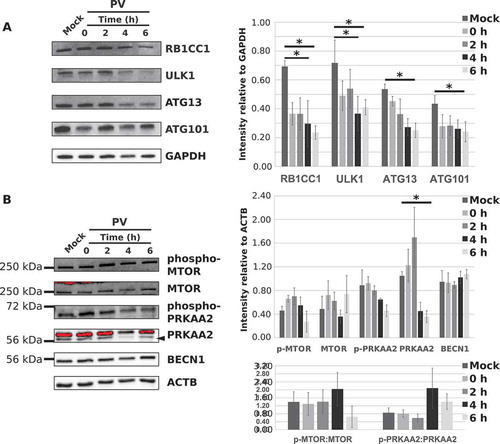
Figure 6. The ULK complex levels decrease during PV infection but upstream or downstream complexes are unaffected. (a) H1-HeLa cells were mock-infected with PBS+ or PV at an MOI = 50 and collected at 0, 2, 4, or 6 hpi. RB1CC1, ULK1, ATG13, and ATG101 levels were assessed via western blot and densitometry analysis. Intensities were corrected to GAPDH. Error bars represent the standard error of the mean of n = 3 independent experiments. Statistical significance was determined via a repeated measures ANOVA with a Tukey/Tukey-Kramer post-hoc test where * p < 0.05. (b) Western blot and densitometry analysis of MTOR, phospho-MTOR (S2448), PRKAA2/AMPKα2 subunit, phospho-PRKAA2 (T172) subunit, and BECN1 levels in H1-HeLa cells that were mock-infected or infected with PV (MOI = 50) for 0, 2, 4, or 6 hpi. Intensities were corrected to ACTB. Error bars represent the standard error of the mean of n = 3 independent experiments. Statistical significance was determined via a repeated measures ANOVA with a Tukey/Tukey-Kramer post-hoc test where * p < 0.05.