
Figures & data
Figure 1. Homology between C. elegans SIN-3 and human SIN3A and SIN3B. Multiple sequence alignment showing homology between the different conserved domains of C. elegans SIN-3 and the human orthologs SIN3A and SIN3B isoforms. T-coffee multiple sequence alignment tool of EMBL-EBI was used (Red boxes depicts conserved sequences and yellow boxes depict similar sequences). a.a., amino acids.
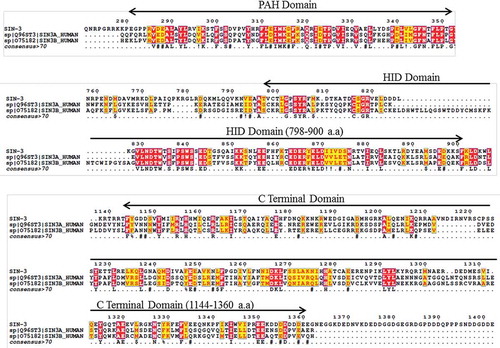
Figure 2. Transient knockdown of sin-3 leads to increased autophagy and reduced lifespan. Representative images of GFP::LGG-1 expression in the seam cells of L3 larvae (A) GFP::LGG-1 transgenic worms, (B) accumulation of GFP-positive puncta in GFP::LGG-1 transgenic worms fed on sin-3 RNAi at 1000X. (C) Quantification of GFP::LGG-1-positive puncta in seam cells of GFP::LGG-1 transgenic and sin-3 RNAi fed GFP::LGG-1 transgenic worms (D) Kaplan-Meier survival curve showing reduction in the lifespan of N2 worms fed on bacteria expressing dsRNAi against sin-3 (solid line depicts control vector L4440 fed and dotted line represents sin-3 RNAi fed N2 worms). The arrows show representative GFP-positive puncta that label phagophores and autophagosomal structures. *** P ≤ 0.0001, between vector alone and sin-3 RNAi fed GFP::LGG-1 transgenic worms. Scale: 500 µm. GFP::LGG-1 transgenic worms have genotype adIs2122[Plgg-1::GFP::LGG-1;rol-6(su1006)]. Twenty worms were analyzed per treatment and the experiment was repeated 3 times.
![Figure 2. Transient knockdown of sin-3 leads to increased autophagy and reduced lifespan. Representative images of GFP::LGG-1 expression in the seam cells of L3 larvae (A) GFP::LGG-1 transgenic worms, (B) accumulation of GFP-positive puncta in GFP::LGG-1 transgenic worms fed on sin-3 RNAi at 1000X. (C) Quantification of GFP::LGG-1-positive puncta in seam cells of GFP::LGG-1 transgenic and sin-3 RNAi fed GFP::LGG-1 transgenic worms (D) Kaplan-Meier survival curve showing reduction in the lifespan of N2 worms fed on bacteria expressing dsRNAi against sin-3 (solid line depicts control vector L4440 fed and dotted line represents sin-3 RNAi fed N2 worms). The arrows show representative GFP-positive puncta that label phagophores and autophagosomal structures. *** P ≤ 0.0001, between vector alone and sin-3 RNAi fed GFP::LGG-1 transgenic worms. Scale: 500 µm. GFP::LGG-1 transgenic worms have genotype adIs2122[Plgg-1::GFP::LGG-1;rol-6(su1006)]. Twenty worms were analyzed per treatment and the experiment was repeated 3 times.](/cms/asset/8f5b5fc0-3ff6-4b3f-b33c-23819a54fa88/kaup_a_1474312_f0002_oc.jpg)
Figure 3. Transient knockdown of sin-3 causes increased autophagic flux but no autophagy-dependent change in lifespan. Kaplan-Meier survival curve showing the lifespan of (A) him-5(e1490) worms and (B) sin-3(tm1279);him-5(e1490) worms fed either control bacteria or bacteria expressing bec-1 or atg-7 dsRNA. No significant difference is observed upon treatment. Representative images of SQST-1::GFP expression in the lateral intestine of (C) sqst-1::GFP;him-5(e1490)worms fed on bacteria expressing empty vector control (left panel) or bacteria expressing dsRNA against sin-3 (right panel) at young adult stage. (D) Quantification of SQST-1::GFP-positive puncta in the lateral intestine of worms fed either control or sin-3 RNAi expressing bacteria. ***P ≤ 0.001 for sin-3 RNAi treatments compared to control vector L4440. 20 worms were analyzed per condition and the experiment was repeated 3 times. Scale bar: 500 µm.
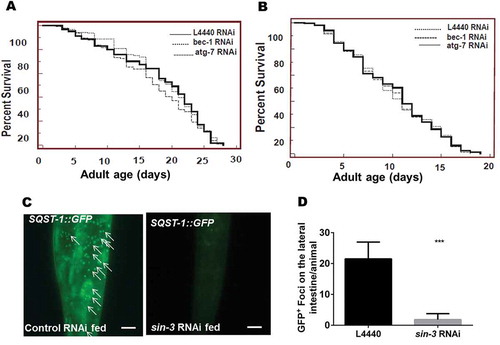
Figure 4. Expression of ROS-mediated genes and intracellular ROS is upregulated in sin-3;him-5 worms. (A) Quantitative RT-PCR was performed using cDNA prepared from N2, him-5(e1490) and sin-3(tm1279);him-5(e1490) worms as a template and primer pairs for the genes indicated along the X-axis. Fold change in the gene expression relative to him-5(e1490) isogenic control is indicated (ns, non-significant; **P < 0.05; ****P < 0.001 and denotes the comparison with respect to him-5(e1490); two-way ANOVA performed). (B) Relative fluorescence units as a measure of ROS were measured in N2 and various mutant worms as described in Materials and Methods, were measured with a microplate fluorescence reader Tecan M1000. (C) Relative fluorescence as compared to the control him-5(e1490). Where, N2: wild-type, sin-3;him-5: sin-3(tm1279);him-5(e1490) mutant, him-5(e1490): isogenic control, daf-16(mu86) and daf-2(e1370) are short lived and long lived mutants (ns, non-significant; **P < 0.05; ****P < 0.001 and denotes the comparison with respect to him-5 [e1490]; one way ANOVA performed).
![Figure 4. Expression of ROS-mediated genes and intracellular ROS is upregulated in sin-3;him-5 worms. (A) Quantitative RT-PCR was performed using cDNA prepared from N2, him-5(e1490) and sin-3(tm1279);him-5(e1490) worms as a template and primer pairs for the genes indicated along the X-axis. Fold change in the gene expression relative to him-5(e1490) isogenic control is indicated (ns, non-significant; **P < 0.05; ****P < 0.001 and denotes the comparison with respect to him-5(e1490); two-way ANOVA performed). (B) Relative fluorescence units as a measure of ROS were measured in N2 and various mutant worms as described in Materials and Methods, were measured with a microplate fluorescence reader Tecan M1000. (C) Relative fluorescence as compared to the control him-5(e1490). Where, N2: wild-type, sin-3;him-5: sin-3(tm1279);him-5(e1490) mutant, him-5(e1490): isogenic control, daf-16(mu86) and daf-2(e1370) are short lived and long lived mutants (ns, non-significant; **P < 0.05; ****P < 0.001 and denotes the comparison with respect to him-5 [e1490]; one way ANOVA performed).](/cms/asset/f57da6b4-b093-4f71-b547-e007214b2f86/kaup_a_1474312_f0004_b.gif)
Figure 5. Confocal images of in vivo DCFDA-stained worms. The fluorescence in the pharynx and overall body of the sin-3;him-5 mutant worm (B) is considerably higher than the wild-type N2 (A), him-5(e1490) isogenic control (D) and short lived mutant daf-16(mu86) (F) worms. The high intracellular fluorescence is restored to basal levels after the sin-3;him-5 worms (C) were grown on NGM plates supplemented with 10 mM vitamin C. No significant difference is observed between him-5(e1490) worms grown on NGM plates with (E) and without vitamin C supplementation (D). 20 worms per strain were photographed and the experiment was repeated 3 times. Images were taken at 200X; scale: 20 µm.
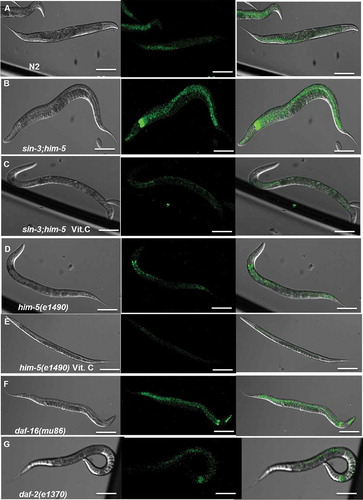
Figure 6. Expression of SOD genes and catalase activity is differentially altered in sin-3;him-5 worms. (A) Quantitative RT-PCR was performed using cDNA prepared from various worm strains indicated along X-axis as template and primer pairs for the genes indicated on top. Fold change in the gene expression w.r.t him-5(e1490) is indicated. (B) Enzymatic activity of catalase depicted as catalase activity in mKmg−1 and (C) catalase activity as percentage of control. N2, wild-type; sin-3;him-5, sin-3(tm1279);him-5(e1490) mutant; sin-3;him-5 Vit. C, sin-3(tm1279);him-5(e1490); him-5(e1490) Vit. C, him-5(e1490) worms maintained on NGM plates supplemented with 10 mM vitamin C. Other mutants are duly indicated on the graph (ns, non-significant; **P < 0.05; ****P < 0.001 and denotes the comparison with respect to him-5[e1490]; one way ANOVA performed, #P < 0.05 and denotes the comparison between sin-3;him-5 and vitamin C-supplemented sin-3;him-5 worms; Student’s paired t test performed).
![Figure 6. Expression of SOD genes and catalase activity is differentially altered in sin-3;him-5 worms. (A) Quantitative RT-PCR was performed using cDNA prepared from various worm strains indicated along X-axis as template and primer pairs for the genes indicated on top. Fold change in the gene expression w.r.t him-5(e1490) is indicated. (B) Enzymatic activity of catalase depicted as catalase activity in mKmg−1 and (C) catalase activity as percentage of control. N2, wild-type; sin-3;him-5, sin-3(tm1279);him-5(e1490) mutant; sin-3;him-5 Vit. C, sin-3(tm1279);him-5(e1490); him-5(e1490) Vit. C, him-5(e1490) worms maintained on NGM plates supplemented with 10 mM vitamin C. Other mutants are duly indicated on the graph (ns, non-significant; **P < 0.05; ****P < 0.001 and denotes the comparison with respect to him-5[e1490]; one way ANOVA performed, #P < 0.05 and denotes the comparison between sin-3;him-5 and vitamin C-supplemented sin-3;him-5 worms; Student’s paired t test performed).](/cms/asset/c9b5384a-9f8b-408a-83b6-50908b7aa677/kaup_a_1474312_f0006_b.gif)
Figure 7. sin-3;him-5 worms have elevated lipid peroxidation levels. (A) Lipid peroxidation levels as measured through 2-phenyl, 2-vinylindole detection of malondialdehyde in various C. elegans strains. (B) Malondialdehyde concentration as percentage of control. N2, wild-type; sin-3;him-5: sin-3(tm1279);him-5(e1490) mutant; sin-3;him-5 Vit. C, sin-3(tm1279);him-5(e1490); him-5(e1490) Vit. C, him-5(e1490) worms maintained on NGM plates supplemented with 10 mM vitamin C. Other mutants are duly indicated on the graph (ns, non-significant; **P < 0.05; ****P < 0.001 and denotes the comparison with respect to him-5 [e1490]; one way ANOVA performed, #P < 0.001 and denotes the comparison between sin-3;him-5 and vitamin C-supplemented sin-3;him-5 worms; paired Student’s t test performed). All experiments were repeated 3 times.
![Figure 7. sin-3;him-5 worms have elevated lipid peroxidation levels. (A) Lipid peroxidation levels as measured through 2-phenyl, 2-vinylindole detection of malondialdehyde in various C. elegans strains. (B) Malondialdehyde concentration as percentage of control. N2, wild-type; sin-3;him-5: sin-3(tm1279);him-5(e1490) mutant; sin-3;him-5 Vit. C, sin-3(tm1279);him-5(e1490); him-5(e1490) Vit. C, him-5(e1490) worms maintained on NGM plates supplemented with 10 mM vitamin C. Other mutants are duly indicated on the graph (ns, non-significant; **P < 0.05; ****P < 0.001 and denotes the comparison with respect to him-5 [e1490]; one way ANOVA performed, #P < 0.001 and denotes the comparison between sin-3;him-5 and vitamin C-supplemented sin-3;him-5 worms; paired Student’s t test performed). All experiments were repeated 3 times.](/cms/asset/36137034-e2eb-414e-92d6-aaeefc728be4/kaup_a_1474312_f0007_b.gif)
Figure 8. Altered redox NADP and glutathione status in sin-3;him-5 worms. (A) Total NADP content in various C. elegans strains in pmole/ml of lysate. (B) Ratio of NADP:NADPH in various strains (C) Total glutathione content in various C. elegans strains in nmole/mg protein. (D) Ratio of GSH:GSSG in different strains. Where N2, wild-type; sin-3;him-5, sin-3(tm1279);him-5(e1490) mutant; sin-3;him-5 Vit. C, sin-3(tm1279);him-5(e1490); him-5(e1490) Vit. C, him-5(e1490) worms maintained on NGM plate supplemented with 10 mM vitamin C. Other mutants are duly indicated on the graph (ns, non-significant; **P < 0.05; ****P < 0.001 and denotes the comparison with respect to him-5[e1490]; one way ANOVA performed, #P < 0.001 and denotes the comparison between sin-3;him-5 and vitamin C-supplemented sin-3;him-5 worms; paired Student’s t test performed). Each experiment was repeated 3 times.
![Figure 8. Altered redox NADP and glutathione status in sin-3;him-5 worms. (A) Total NADP content in various C. elegans strains in pmole/ml of lysate. (B) Ratio of NADP:NADPH in various strains (C) Total glutathione content in various C. elegans strains in nmole/mg protein. (D) Ratio of GSH:GSSG in different strains. Where N2, wild-type; sin-3;him-5, sin-3(tm1279);him-5(e1490) mutant; sin-3;him-5 Vit. C, sin-3(tm1279);him-5(e1490); him-5(e1490) Vit. C, him-5(e1490) worms maintained on NGM plate supplemented with 10 mM vitamin C. Other mutants are duly indicated on the graph (ns, non-significant; **P < 0.05; ****P < 0.001 and denotes the comparison with respect to him-5[e1490]; one way ANOVA performed, #P < 0.001 and denotes the comparison between sin-3;him-5 and vitamin C-supplemented sin-3;him-5 worms; paired Student’s t test performed). Each experiment was repeated 3 times.](/cms/asset/86e6037d-483f-45b2-a0a8-85dd41304146/kaup_a_1474312_f0008_b.gif)
Figure 9. Altered lifespan and autophagy are rescued by supplementation of vitamin C in the background of sin-3 deletion. Kaplan-Meier survival curve showing the lifespan of (A) him-5(e1490) (solid line), him-5 (e1490) isogenic control worms maintained on NGM plates supplemented with vitamin C (dotted line); (B) sin-3(tm1279);him-5(e1490) (solid line), sin-3(tm1279);him-5(e1490) worms maintained on NGM plates supplemented with vitamin C (dotted line). (*P ≤ 0.0001, between sin-3(tm1279);him-5(e1490) worms maintained on normal NGM plates or NGM plates containing 10 mM vitamin C. (C) Representative images of GFP::LGG-1 expression in the intestine of L3 larvae in adIs2122(Plgg-1::GFP::LGG-1;rol-6[su1006]) (denoted as GFP::LGG-1) worms fed on bacteria expressing dsRNA against sin-3 grown either on normal NGM plates (left panel) or (D) NGM plates containing 10 mM vitamin C (right panel). (E) Relative mRNA expression levels of atf-5 in GFP::LGG-1 and (F) GFP::SQST-1 transgenic worms when grown on either NGM or NGM plates supplemented with 10 mM vitamin C and fed either bacteria expressing sin-3 RNAi or control vector. (G) Levels of GFP protein tagged with LGG-1 and the lipidated GFP::LGG-1-PE in worms fed on bacteria expressing control RNAi and sin-3 RNAi and grown either on NGM or NGM supplemented with 10 mM vitamin C were examined by western blot. Actin was used as loading control. (H) Densitometric quantification of the band intensity using ImageJ software. (****P < 0.0001, one-way ANOVA performed). Images were acquired at 1000X, 20 animals per treatment were visualized and the experiment was repeated 3 times. Scale: 500 µm.
![Figure 9. Altered lifespan and autophagy are rescued by supplementation of vitamin C in the background of sin-3 deletion. Kaplan-Meier survival curve showing the lifespan of (A) him-5(e1490) (solid line), him-5 (e1490) isogenic control worms maintained on NGM plates supplemented with vitamin C (dotted line); (B) sin-3(tm1279);him-5(e1490) (solid line), sin-3(tm1279);him-5(e1490) worms maintained on NGM plates supplemented with vitamin C (dotted line). (*P ≤ 0.0001, between sin-3(tm1279);him-5(e1490) worms maintained on normal NGM plates or NGM plates containing 10 mM vitamin C. (C) Representative images of GFP::LGG-1 expression in the intestine of L3 larvae in adIs2122(Plgg-1::GFP::LGG-1;rol-6[su1006]) (denoted as GFP::LGG-1) worms fed on bacteria expressing dsRNA against sin-3 grown either on normal NGM plates (left panel) or (D) NGM plates containing 10 mM vitamin C (right panel). (E) Relative mRNA expression levels of atf-5 in GFP::LGG-1 and (F) GFP::SQST-1 transgenic worms when grown on either NGM or NGM plates supplemented with 10 mM vitamin C and fed either bacteria expressing sin-3 RNAi or control vector. (G) Levels of GFP protein tagged with LGG-1 and the lipidated GFP::LGG-1-PE in worms fed on bacteria expressing control RNAi and sin-3 RNAi and grown either on NGM or NGM supplemented with 10 mM vitamin C were examined by western blot. Actin was used as loading control. (H) Densitometric quantification of the band intensity using ImageJ software. (****P < 0.0001, one-way ANOVA performed). Images were acquired at 1000X, 20 animals per treatment were visualized and the experiment was repeated 3 times. Scale: 500 µm.](/cms/asset/b505f2b3-001c-4709-ac08-d0a744cccaca/kaup_a_1474312_f0009_oc.jpg)