
Figures & data
Figure 1. Blast result of the cloned AANAT gene and pIRES2-EGFP-AANAT expression vector construction. (A) The nucleic acid sequence of AANAT gene blasted with NCBI reference sequence; (B) Amino acid sequence alignment; (C) Construction of the pIRES2-EGFP-AANAT expression vector.
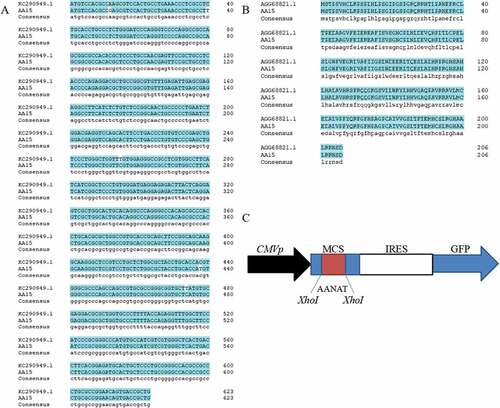
Figure 2. Preparation of AANAT transgenic FFCs as donor cells for SCNT. (A and B) Photos of cultured FFCs using attaching tissue explants method. (A) Cells grew out from tissue explants, scale bars: 50 μm. (B) Passaged FFCs, scale bars: 200 μm. (C) Positive rate of FFCs at 48 h after electrotransfection, scale bars: 200 μm. (D) Selected positive monocolonal cells, scale bars: 50 μm. (E) The ‘S’ shape of growth curve. (F) The SRY-PCR sex analysis of the 2 fetuses. M, Marker; 1and 2, fetus; 3, known male goat; 4, known female goat. (G) Positive monocolonal cell identification. M, Marker; 1, pIRES2-EGFP-AANAT expression vector; 2, the No. 4 monoclonal cells; 3, the No. 6 monoclonal cells; 4, the No. 7 monoclonal cells; 5, the nontransgenic FFCs; 6, blank control. (H) qRT-PCR analysis of the AANAT expression quantity of the No. 6 monoclonal cells. (I) Western blot analysis of the AANAT expression quantity of the No. 6 monoclonal cells. ‘*’Represents significant differences, P < 0.05; ‘**’represents highly significant differences, P < 0.01. The same applies to the following figures.
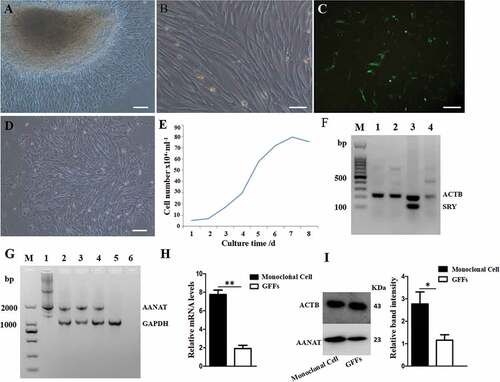
Table 1. The effect of melatonin on SCNT efficiency.
Figure 3. General conditions of the goats. (A) Photo of the 7 transgenic cloned goats. (B) The weight and growth rate of the animals.
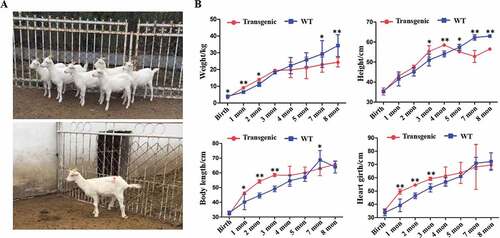
Figure 4. PCR-Sequencing and Southern blot analysis of transgenic goats. (A) The results from agarose gel electrophoresis of the PCR products. M, Marker; P, pIRES2-EGFP-AANAT; 1 to 7, 7 transgenic goats, respectively; C1 and C2, 2 negative control animals, respectively; B, Blank. (B) Sequenced and blasted results. (C) Southern blot analysis. 1 to 7, 7 transgenic goats, respectively; C, negative control; P1, pIRES2-EGFP-AANAT one copy; P2, pIRES2-EGFP-AANAT 2 copies; P3, pIRES2-EGFP-AANAT 3 copies.
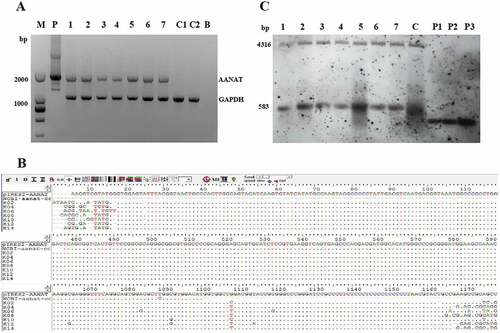
Figure 5. The levels of AANAT expression and serum melatonin in transgenic goats compared to the WT. (A) mRNA expression. (B) Protein levels. (C) Serum melatonin.
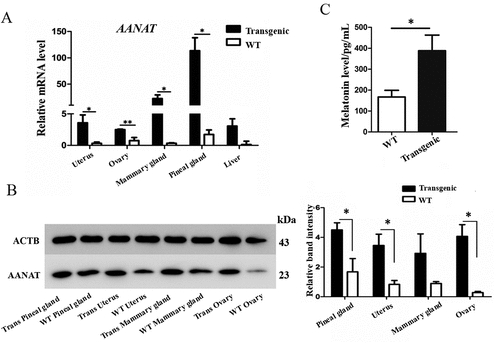
Figure 6. The AANAT, ASMT and MTNR1B expression, levels of melatonin and proinflammatory cytokines in the PBMCs. (A) A representative gel of AANAT, ASMT and MTNR1B genes (M, Marker; 1, ACTB; 2, AANAT; 3, ASMT; 4, MTNR1A; 5, MTNR1B. (B) AANAT expression in transgenic and wild-type goats treated with or without LPS. (C) Melatonin level in the transgenic and wild-type goat PBMCs. (D) IL1B, IL12, IL6 and TNF levels in wild-type, transgenic goat and transgenic goat treated with 3MA.
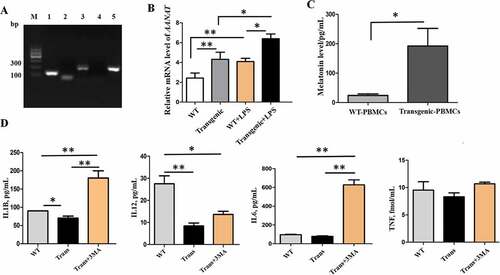
Figure 7. The autophagy indices in PBMCs. (A) Electron microscopy images of autophagosomes (green arrows point to autophagosomes); scale bars: 1 µm. (B) Statistical analysis of autophagosomes. (C) Immunofluorescence staining images of LC3B in the different treatments; scale bars: 50 µm. (D) Immunofluorescence staining of LC3B was measured with flow cytometry analysis.
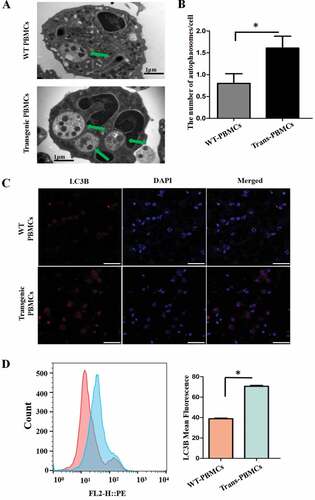
Figure 8. The proinflammatory cytokines and autophagy levels in the PBMCs after adding different inhibitors. (A) The concentration of IL2, IL12, and TNF. (B) qRT-PCR analysis of autophagy-associated genes WIPI1, BECN1 and PIK3R1 in the PBMCs. (C) Immunofluorescence staining images of LC3B; scale bars: 50 μm. (D) The concentration of IL1B, IL2, IL12 and TNF with 4-P-PDOT. (E) WIPI1, BECN1 and PIK3R1 with 4-P-PDOT. (F) Immunofluorescence staining of LC3B with flow cytometry analysis after adding 4-P-PDOT.
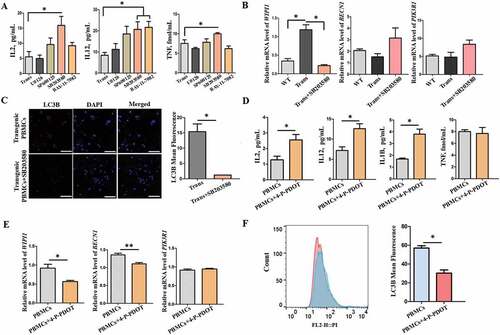
Figure 9. The serum proinflammatory cytokines and melatonin level in wild-type and transgenic goats treated with or without LPS or LPS+ MT. (A) Melatonin levels. (B) IL2 levels. (C) IL6 levels. (D) TNF levels. (E) IL8 levels. (F) IL12 (IL12A-IL12B/p70) levels. MT, melatonin; Trans, transgenic goats; WT, wild-type goats.
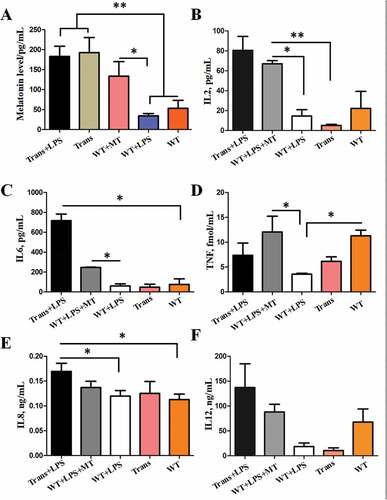
Figure 10. The autophagy level of the PBMCs from wild-type and transgenic goats treated with or without LPS/LPS+ MT. (A to C) Expression of BECN1, ATG5 and WIPI1 in the PBMCs. (D) Protein levels of BECN1, ATG5, LC3B, p-MAPK14/p38 and NLRP3. (E to I) Statistical analysis of protein levels.
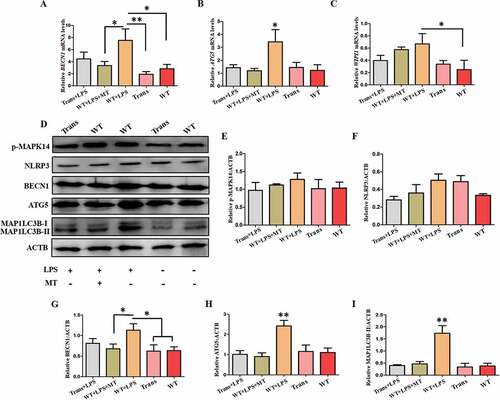
Figure 11. Proteogenomic analysis. (A) Expression of proteins in PBMCs from LPS-treated transgenic and WT goats. (B) The number of GO terms and KEGG-enriched pathways. (C) Protein expression in GO terms (fold change> 1.3).
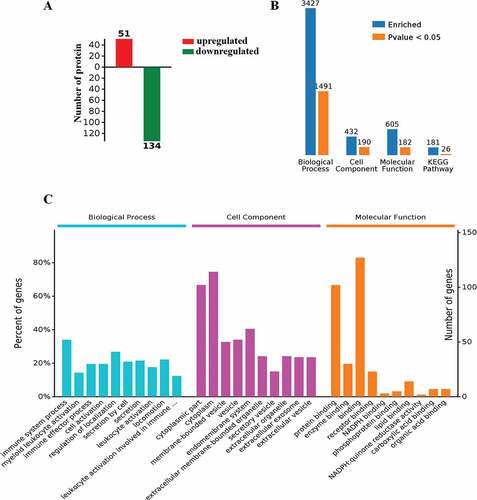
Figure 12. Functional analysis of the PBMCs from LPS-treated transgenic and WT goats. (A) Autophagy-related GO terms. (B) Autophagy-related GO terms. Red, upregulation; green, downregulation (Trans vs WT). (C) The expression of autophagy-related proteins. Red, upregulation; green, downregulation (Trans vs WT). (D) Oxidative stress-related GO terms. (E) Oxidative stress-related GO terms. Red, upregulation; green, downregulation. (F) The expression of oxidative stress-related proteins. Red, upregulation; green, downregulation (Trans vs WT).
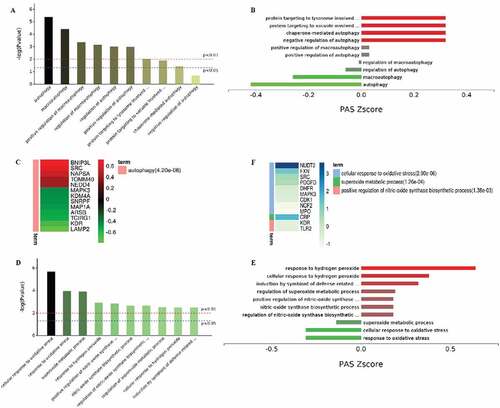
Figure 13. The proposed pathway of the effects of melatonin on inflammation and autophagy in the in vitro and in vivo conditions. ATG, autophagy-related; BECN1/BECLIN1, beclin 1, MAPK1/3, mitogen-activated protein kinase 1/3; MAPK, mitogen-activated protein kinase; IL1B, interleukin 1 beta; IL2, interleukin 2; IL6, interleukin 6; IL12, interleukin 12 (IL12A-IL12B/p70), LPS, lipopolysaccharide; MAP1LC3B/LC3B, microtubule associated protein 1 light chain 3 beta; MAPK14/p38, mitogen-activated protein kinase 14; melatonin, N-acetyl-5-methoxytryptamine; MTNR1B, melatonin receptor 1B; NFKB, nuclear factor kappa B; ROS, reactive oxygen species; WIPI1, WD repeat domain, phosphoinositide interacting 1.
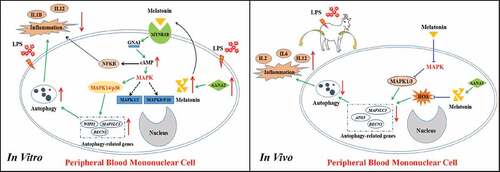
Table 2. Primers for SRY identification.
Table 3. Primers for transgenic offspring identification.
Table 4. Primers for qRT-PCR.