
Figures & data
Figure 1. CCA-induced mitochondrial biogenesis. Differentiated myotubes were chronically stimulated to induce mitochondrial biogenesis in the presence of vehicle or bafilomycin A1 (BafA). (A) Cytochrome oxidase (COX) activity (*P < 0.05, vs. vehicle control; †P < 0.05, main effect of BafA vs. vehicle; n = 6). (B) Representative western blot of whole cell extracts probed for COX4I1 and PGM5 protein expression. (C) Graphical densitometric quantification, COX4I1 normalized to PGM5. (*P < 0.001 vs. vehicle Con; n = 8.) A.U., arbitrary units.
Figure 2. Mitochondrial respiration and ROS production. Mitochondria were isolated from myotube tissue culture by differential centrifugation. State 4 and state 3 respiration were measured and normalized to protein concentration. ROS production was determined on isolated mitochondria and normalized to respiration. (A) State 4 and state 3 respiration (*P < 0.05, vs. Con state 4; †P < 0.001, vs. Con state 3; ‡P < 0.05, BafA+ CCA vs. BafA control; n = 4). (B) Mitochondrial ROS production (*P < 0.05, vs. Con state 4; †P < 0.001, vs. con State 3; ‡P < 0.05, BafA+ CCA vs. BafA control; n = 4). (C) Representative western blot of SOD2 and TUBA/α-TUBULIN protein expression. (D) Graphical quantification, SOD2 normalized to TUBA († P < 0.001, main effect of BafA vs. vehicle; n = 6). A.U., arbitrary units. natoms, nanoatoms.
Figure 3. Real-time PCR analysis of mitophagy mRNA expression in control and CCA myotubes, treated with vehicle (Con) or bafilomycin A1 (BafA). Transcript levels were normalized to both Actb and Gapdh (*P < 0.05, vs. control levels of the same transcript).
Figure 4. Expression of autophagy proteins in response to CCA in C2C12 myotubes, treated with bafilomycin A1 (BafA). (A) Representative western blot. (B) Graphical densitometric quantification; LC3-II normalized to TUBA/α-tubulin protein (*P < 0.001, BafA CCA vs. BafA control; †P < 0.001, main effect of BafA vs. vehicle n = 8). (C) LC3-II normalized to LC3-I protein (*P < 0.001, BafA CCA vs. BafA control; †P < 0.001, main effect of BafA vs. vehicle n = 8). A.U., arbitrary units. (D) Fully differentiated myotubes were chronically stimulated to induce mitochondrial biogenesis in the presence of vehicle or BafA. Fluorescence microscopy of C2C12 myotubes co-expressing GFP-LC3 and mitoDs-Red at 60x magnification; scale bar: 10 µm.
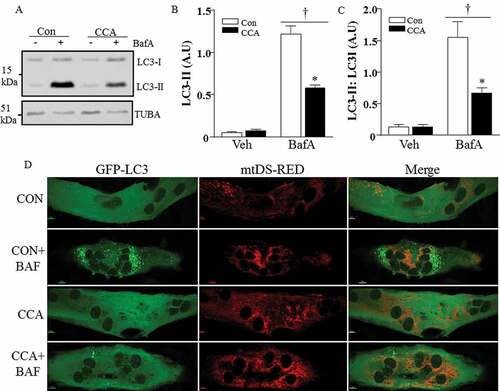
Figure 5. Expression of autophagy proteins in response to CCA in C2C12 myotubes treated with bafilomycin A1 (BafA). Representative western blots. (A) Whole cell extracts were probed for SQSTM1 and GAPDH, and (C) mitochondrial fractions were probed for SQSTM1 and VDAC. Graphical densitometric quantification. (B) Total SQSTM1 normalized to GAPDH (†P < 0.01, main effect of BafA vs. vehicle; * P < 0.05, vehicle BafA vs. BafA + CCA; #, P < 0.05 interaction effect between CCA and BafA treatment, n = 5). (D) Mitochondrial SQSTM1 (†P < 0.001, main effect of BafA vs. vehicle; *P < 0.01, BafA control vs. BafA + CCA; n = 3). A.U., arbitrary units.
Figure 6. Expression of lysosomal proteins in response to CCA in C2C12 myotubes treated with bafilomycin A1 (BafA). (A) Representative western blots of whole cell extracts were probed for CTSD, LAMP2, TFEB, p-RPS6KB, PPARGC1A, GAPDH and PGM5. Graphical densitometric quantification: (B) CTSD normalized to PGM5 (*P < 0.05, CCa vs. Con, n = 6); (C) LAMP2 normalized to PGM5 (*P < 0.05, BafA control vs. vehicle control, n = 6); (D) TFEB normalized to GAPDH (*P < 0.05, CCA vs. vehicle control, n = 5). (E) PPARGC1A normalized to GAPDH (*P < 0.05 CCA vs. vehicle control, n = 4).
Figure 7. Autophagy flux with co-incubation of NAC (N-acetylcysteine) and BafA in muscle cells. (A) Representative western blots of whole cell extracts probed with antibodies to LC3, SQSTM1 and TUBA/α-TUBULIN, used as a loading control. (B) Graphical representation of autophagy flux. (*P < 0.05, overall effect of NAC vs. vehicle; n = 3.) A.U., arbitrary units.
Table 1. List of primer oligonucleotide sequences used in real-time qPCR analysis for Mus musculus.