Figures & data
Figure 1. CASP4/caspase-11 contributes to the restriction of B. cenocepacia in vitro. (a) Intracellular survival of B. cenocepacia MH1K (B.c.) in WT and casp4−/- macrophages. Data represent mean ± SEM (n = 9). Statistical analysis was performed using two-way ANOVA. (b) Immunofluorescence assay of intracellular B. cenocepacia in WT and casp4−/- macrophages at 6 h post infection. White arrows point to B. cenocepacia. (c) Quantification of intracellular B. cenocepacia in WT and casp4−/- macrophages at 6 h post infection. Values are mean percentage ± SEM calculated by scoring 60 randomly chosen fields of view from 3 experiments. Statistical analyses were performed using a linear mixed effects model. (d) B. cenocepacia-induced cytotoxicity was calculated by measuring LDH release in supernatants from WT and casp4−/- macrophages at 6 h post infection. Statistical analyses were performed using one-way ANOVA. (e) Immunoblot analysis of CASP4 from WT and casp4−/- macrophages infected with B. cenocepacia MH1K at 6 h post infection. (f) CASP1 immunoblot analysis of whole cell lysates from WT and casp4−/- macrophages infected with B. cenocepacia MH1K at 6 h post infection. (g) Densitometry analysis of CASP4 (n = 3) and cleaved CASP1 (n = 5) at 6 h post infection. Shown are mean ± SEM. Statistical analysis was performed using two-way ANOVA. (h) Cytokine release at 6 h from WT, casp4−/- and casp1−/- macrophages infected with B. cenocepacia (n = 9). Shown are mean ± SEM. Statistical analysis was performed using one-way ANOVA. *p ≤ 0.05, **p ≤ 0.01, ***p ≤ 0.001. NT, no treatment.
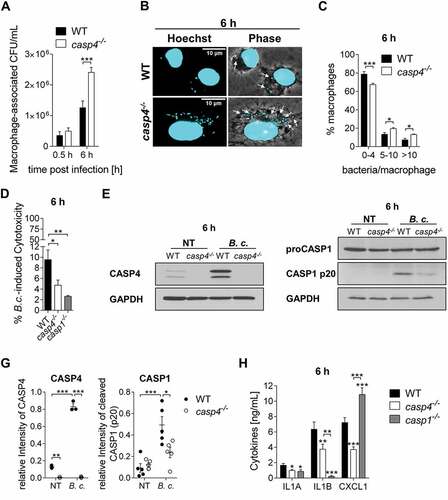
Figure 2. CASP4/caspase-11 contributes to the restriction of B. cenocepacia in vivo. (a) In vivo CFU from lung, liver and spleen of WT and casp4−/- mice infected with B. cenocepacia K-56 (B.c.) at 4 h (n = 9) and 48 h (n = 10). Pooled data from 2 independent experiments are shown as mean ± SEM. Statistical analysis was performed using two-tailed Student’s t-test. (b) Survival of WT and casp4−/- mice after intratracheal infection with 30 × 106 CFU. Pooled data from 2 independent experiments (n = 8). Statistical analysis was performed using Log-rank (Mantel-Cox) test. (c) Cytokine levels at 24 h in the BALF of WT (n = 7) and casp4−/- (n = 6) mice after intratracheal infection with 30 × 106 CFU. Statistical analysis was performed using two-way ANOVA. (d) Representative 10x (upper panel) and 60x (lower panel) magnification of H&E-stained lung sections from WT and casp4−/- mice showing increased inflammatory infiltrate within the WT sections. (e) MPO levels at 24 h in the BALF of WT and casp4−/- mice treated as in (C). Statistical analysis was performed using two-way ANOVA. *p ≤ 0.05, **p ≤ 0.01, ***p ≤ 0.001.
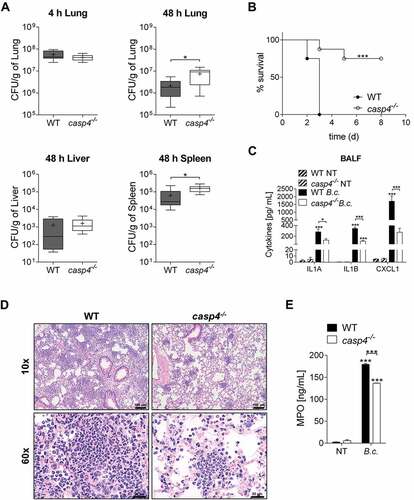
Figure 3. CASP4/caspase-11 promotes autophagosome formation in response to pathogenic bacteria. (a) LC3 immunofluorescence assay of B. cenocepacia (B.c.)-infected WT and casp4−/- macrophages at 30 min post infection. White arrows point to B. cenocepacia-LC3 colocalization. (b) Quantification of B. cenocepacia colocalized with LC3. (c) Quantification of total LC3 puncta in B. cenocepacia-infected WT and casp4−/- macrophages using ImageJ Software. a.u., arbitrary units. (d) Quantification of E. coli colocalized with LC3 in WT and casp4−/- macrophages. (A-D) Values are mean percentage ± SEM calculated by scoring 24 randomly chosen fields of view from at least 3 experiments. Statistical analyses were performed using Student’s t-test. (e) LC3-II immunoblot analysis from B. cenocepacia-infected WT and casp4−/- macrophages at 6 h post infection. (f) Densitometry analysis of B. cenocepacia-induced LC3-II in WT and casp4−/- macrophages at 6 h post infection. Shown are mean ± SEM of 7 independent experiments (n = 7). Statistical analysis was performed using two-way ANOVA. (g) LC3 immunoblot analysis in WT macrophages at 2 h after infection with B. cenocepacia wild-type, B. cenocepacia T6SS mutant and E. coli. (h) Densitometry analysis of LC3-II in WT macrophages treated as in (G). Shown are mean ± SEM of 5 independent experiments (n = 5). Statistical analysis was performed using one-way ANOVA. (i) Qualitative transmission electron microscopy images of B. cenocepacia-infected WT and casp4−/- macrophages at 2 h post infection. White arrows indicate a multilamellar membrane characteristic for autophagosomes. Black arrow indicates a single-membrane vacuole. *p ≤ 0.05, **p ≤ 0.01, ***p ≤ 0.001. No treatment (NT).
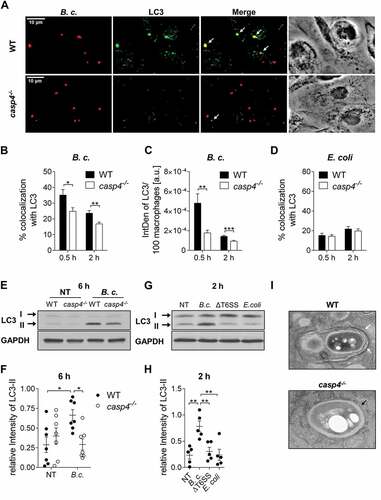
Figure 4. CASP4/caspase-11 and CASP1 modulate trafficking of the B. cenocepacia-containing vacuole. (a) LysoTracker Green immunofluorescence assay of B. cenocepacia (B.c.)-infected WT and casp4−/- macrophages at 2 h post infection. White arrows point to B. cenocepacia-LysoTracker colocalization. (b) Quantification of B. cenocepacia colocalized with LysoTracker Green in WT and casp4−/- macrophages. Statistical analyses were performed using Student’s t-test. (c) Quantification of total LysoTracker Green in B. cenocepacia-infected WT and casp4−/- macrophages shown in A-B using ImageJ Software. Values are mean ± SEM calculated by scoring 24 randomly chosen fields of view from at least 3 independent experiments. Statistical analyses were performed using Student’s t-test. a.u., arbitrary units. (d) Total LysoTracker Green fluorescence in WT macrophages. Shown are mean ± SEM of 15 independent experiments (n = 15). Statistical analysis was performed using one-way ANOVA. (e) LysoTracker Green immunofluorescence assay of B. cenocepacia-infected WT and casp1−/- macrophages at 2 h post infection. White arrows point to B. cenocepacia-LysoTracker colocalization. (f) Quantification of B. cenocepacia colocalized with LysoTracker Green WT and casp1−/- macrophages. Statistical analyses were performed using Student’s t-test. (g) Quantification of total LysoTracker Green in B. cenocepacia-infected WT and casp1−/- macrophages shown in E-F using ImageJ Software. Values are mean ± SEM calculated by scoring 24 randomly chosen fields of view from at least 3 experiments. Statistical analyses were performed using Student’s t-test. *p ≤ 0.05, **p ≤ 0.01, ***p ≤ 0.001. NT, no treatment.
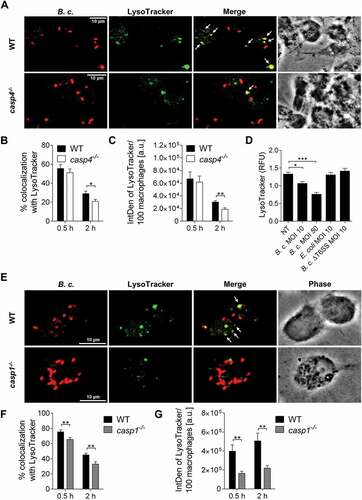
Figure 5. Autophagosome formation in response to B. cenocepacia requires active CASP1. (a) LC3 immunofluorescence assay of B. cenocepacia (B.c.)-infected WT and casp1−/- macrophages at 2 h post infection. White arrows point to B. cenocepacia-LC3 colocalization. (b) Quantification of B. cenocepacia colocalized with LC3. (c) Quantification of total LC3 puncta in B. cenocepacia-infected WT and casp1−/- macrophages using ImageJ Software. Values are mean percentage ± SEM calculated by scoring 24 randomly chosen fields of view from at least 3 experiments. Statistical analyses were performed using Student’s t-test. a.u., arbitrary units. (d) LC3-II immunoblot analysis from B. cenocepacia-infected WT macrophages treated with Ac-YVAD-CMK (50 µM) at 6 h post infection. (e) Densitometry analysis of B. cenocepacia-induced LC3-II in WT macrophages treated with Ac-YVAD-CMK at 6 h post infection. Shown are mean ± SEM of 6 independent experiments (n = 6). Statistical analysis was performed using two-way ANOVA. *p ≤ 0.05, **p ≤ 0.01, ***p ≤ 0.001. NT, no treatment.
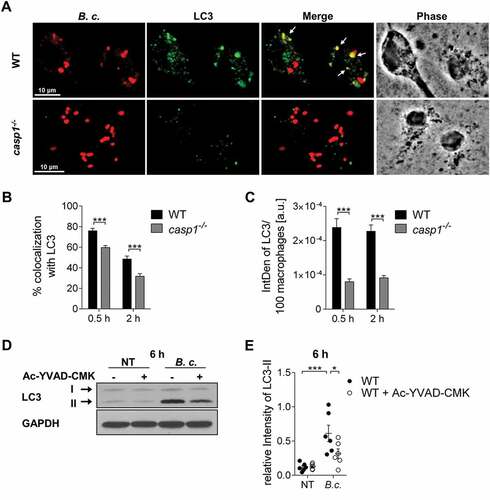
Figure 6. casp4−/-/caspase-11−/- macrophages accumulate RAB7 around the B. cenocepacia-containing vacuole. (a) RAB7 immunofluorescence assay of B. cenocepacia (B.c.)-infected WT and casp4−/- macrophages at 30 min post infection. White arrows point to B. cenocepacia-RAB7 colocalization. (b) Quantification of B. cenocepacia colocalized with RAB7. (c) Quantification of RAB7 in B. cenocepacia-infected WT and casp4−/-macrophages using ImageJ Software. (A-C) Values are mean percentage ± SEM calculated by scoring 24 randomly chosen fields of view from at least 3 experiments. Statistical analyses were performed using Student’s t-test. a.u., arbitrary units. (d) RAB7 immunoblot analysis from WT and casp4−/- macrophages infected with B. cenocepacia at 30 min post infection. (e) Densitometry analysis of RAB7 in B. cenocepacia-infected WT and casp4−/- macrophages. Shown are mean ± SEM of 6 independent experiments (n = 6). Statistical analyses were performed using paired t-test. (f) Immunoprecipitation of GTP-bound RAB7 in B. cenocepacia-infected WT and casp4−/- macrophages at 2 h post infection. (g) Densitometry analysis of active RAB7 in B. cenocepacia-infected WT and casp4−/- macrophages. Shown are mean ± SEM of 4 independent experiments (n = 4). Statistical analyses were performed using paired t-test. *p ≤ 0.05, **p ≤ 0.01, ***p ≤ 0.001.
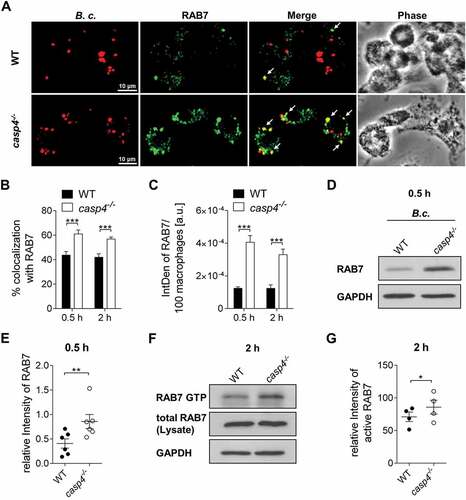
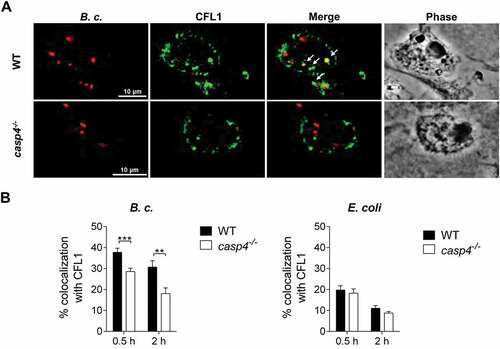
Figure 7. CFL1 associates with the B. cenocepacia-containing phagosome. (a) CFL1 immunofluorescence assay of B. cenocepacia (B.c.)-infected WT and casp4−/-macrophages at 30 min post infection. White arrows point to B. cenocepacia-CFL1 colocalization. (b) Quantification of B. cenocepacia and E. coli colocalized with CFL1 in WT and casp4−/- macrophages. Values are mean percentage ± SEM calculated by scoring 24 randomly chosen fields of view from at least 3 experiments. Statistical analyses were performed using Student’s t-test. **p ≤ 0.01, ***p ≤ 0.001.