Figures & data
Figure 1. OPTN targets soluble MAPT species in vitro. (a) Representative western blot image of total MAPT levels in wild-type (WT), SQSTM1 KO, OPTN KO, penta KO, and ATG5 KO HeLa cells. (b) Quantitative analysis of the sum of all MAPT bands in (a). (c) Representative western blot image of total MAPT levels in penta KO HeLa cells transfected with empty vector (CMV), or plasmids encoding SQSTM1, or OPTN. SQSTM1 and OPTN overexpression was confirmed using their respective antibodies. (d) Quantitative analyses of the sum of all MAPT bands in (c) showing rescue of increased total MAPT in penta KO cells by OPTN but not SQSTM1. (e) Representative western blot image of total MAPT levels in OPTN KO HeLa cells transfected with empty vector (CMV) or a plasmid encoding OPTN. Western blots images show that total MAPT level is rescued by re-introducing OPTN in OPTN KO cells. (f) Quantification of the sum of all MAPT bands in (e) showing the rescue of MAPT clearance by re-introducing OPTN in penta KO cells. HeLa cells transfected with empty vector was used as a control in transfection studies. TUBG was used as a loading control in all western blot analyses. The total MAPT antibody was from DAKO. Data are presented as relative levels of protein:TUBG and expressed as mean ± SEM (n = 3 of 3 experiments). NS, non-significant; *P ≤ 0.05; **P ≤ 0.01; ***P ≤ 0.001.
Figure 2. SQSTM1 targets insoluble mutant MAPT species in vitro. (a) Experimental scheme of seeding-based cellular assay. Brain lysate from rTg4510 mice was added into the medium of HEK293 cells expressing MAPT-PL-V5, which was followed by ultracentrifugation of cell lysate into soluble and insoluble fractions. (b) Representative western blot image of PHF1 and V5 mutant MAPT in soluble and insoluble fractions harvested from the HEK293 cells transfected with empty vector (CMV), or a plasmid encoding SQSTM1 or OPTN. SQSTM1 and OPTN overexpression was confirmed using their respective antibodies. (c) Quantification of (b) demonstrating potent inhibition of both soluble and insoluble mutant MAPT by OPTN while significant reduction of only insoluble mutant MAPT was seen in SQSTM1 transfected cells. (d) Representative western blot image of PHF1 MAPT by siRNA knockdown of SQSTM1 (siSQSTM1) in the MAPT-PL-V5 expressing HEK293 cells. SQSTM1 reduction was confirmed using the anti-SQSTM1 antibody. (e) Quantitative analysis of (d) showing increases of insoluble mutant MAPT. HEK293 cells transfected with non-targeting siRNA was used as a control in transfection studies. (f) Representative western blot image of PHF1-positive MAPT in soluble and insoluble fractions harvested from the WT and ATG5 KO HeLa cells. (g) Quantitative analysis of (f) showing an autophagy-dependent function of SQSTM1. (h) Representative images of immunostaining showing that SQSTM1 decreases insoluble mutant MAPT (MC1) in seeded primary rTg4510 mouse neurons. Images are shown in pseudocolor: Gray, DAPI; red, MC1; green, SQSTM1. Scale Bar: 20 μm. (I) Quantitative analysis of (h). TUBG was used as a loading control in all western blot analyses. Data are presented as relative levels of protein:TUBG and expressed as mean ± SEM (n = 3 of 3 experiments). NS, non-significant; **P ≤ 0.01; ***P ≤ 0.001.
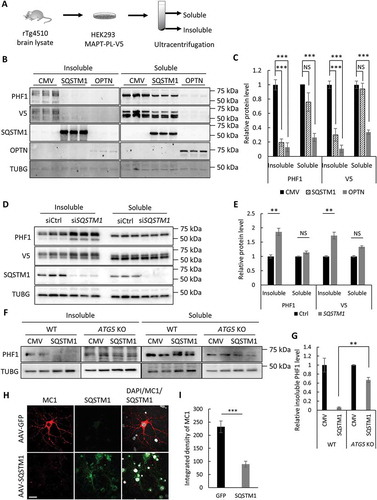
Figure 3. Structure-function analysis of SQSTM1 in seeding assay. (a) Schematic representation of domain structures in FL (full-length) SQSTM1, the SQSTM1-ΔPB1 (SQSTM1 deleting the PB1 domain), SQSTM1-PB1 (PB1 domain alone), SQSTM1-LIR mut (LIR mutant 335-DDDW-338 to 335-AAAA-338) and SQSTM1-ΔUBA (deleting the UBA domain). All constructs were FLAG-tagged at the C terminus. (b) Representative western blot image of PHF1 mutant MAPT in soluble and insoluble fractions from the MAPT-PL-V5 expressing HEK293 cells transfected with empty vector (CMV), SQSTM1-FL, or ΔPB1 mutant. SQSTM1 overexpression was confirmed using the anti-FLAG antibody. (c) Quantitative analyses of (b) showing that SQSTM1-ΔPB1 failed to promote PHF1 mutant MAPT degradation. (d) Representative western blot image of PHF1 mutant MAPT in soluble and insoluble fractions from the MAPT-PL-V5-expressing HEK293 cells transfected with empty vector (CMV) or a plasmid encoding SQSTM1-PB1. Endogenous SQSTM1 was detected using an anti-SQSTM1 antibody (SQSTM1) while SQSTM1-PB1 expression was visualized using the anti-FLAG antibody (FLAG). (e) Quantification of (d) showing increased insoluble PHF1 mutant MAPT by SQSTM1-PB1 expression. (f) Representative western blot image of PHF1 mutant MAPT in soluble and insoluble fractions from the MAPT-PL-V5-expressing HEK293 cells transfected with empty vector (CMV), or a plasmid encoding SQSTM1-FL, or the SQSTM1-LIR mutant. SQSTM1 overexpression was confirmed using the anti-FLAG antibody. (j) Quantitative analyses of (f) showing that the SQSTM1-LIR mut failed to promote PHF1 mutant MAPT degradation. (h) Representative western blot image of PHF1 mutant MAPT in soluble and insoluble fractions from the MAPT-PL-V5-expressing HEK293 cells transfected with empty vector (CMV), or a plasmid encoding the SQSTM1-ΔUBA mutant. SQSTM1 overexpression was confirmed using the anti-FLAG antibody. (g) Quantitative analyses of (i) showing SQSTM1-ΔUBA was still functional in PHF1 mutant MAPT degradation. HEK293 cells transfected with empty vector was used as a control in transfection studies. TUBG was used as a loading control in all western blot analyses. Data are presented as relative levels of protein:TUBG and expressed as mean ± SEM (n = 3 of 3 experiments). NS, non-significant; *P ≤ 0.05; ***P ≤ 0.001.
Figure 4. Mutant MAPT aggregates associate with SQSTM1. (a) Representative fluorescence images of ThioS, SQSTM1 or combined (Merge) of MAPT-PL-V5-expressing HEK293 cells seeded with control (Ctrl) or MAPT (rTg4510) lysates, showing a high degree of colocalization between SQSTM1 and ThioS. (b) Representative costaining images in the cortex of rTg4510 mice showing similar colocalization of SQSTM1 with ThioS. (c) Representative costaining images in the cortex of rTg4510 mice showing similar colocalization of SQSTM1 with AT8 and MC1. (d) Quantification of colocalization between SQSTM1 and ThioS, AT8, and MC1 in (b) and (c). (e) Representative western blot image of SQSTM1 in control (Ctrl) or rTg4510 in insoluble or soluble fractions or total brain lysates (Total). (f) Quantification of relative levels of SQSTM1:TUBG (n = 3). Scale Bar: 20 μm in (a); 200 μm in (b) and (c). All data are expressed as mean ± SEM. NS, non-significant; *P ≤ 0.05; ***P ≤ 0.001.
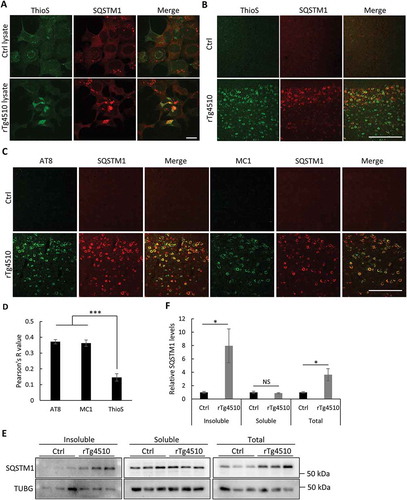
Figure 5. Mutant MAPT aggregates reduce autophagy. (a) Representative fluorescence images of ThioS and MAP1LC3B in MAPT-seeded MAPT-PL-V5-expressing HEK293 cells treated with DMSO or bafilomycin A1 (200 nM, 16 h). Individual ThioS-positive cells are highlighted by dotted lines, ThioS-negative cells are indicated by white asterisks. (b) Quantitative analysis of MAP1LC3B puncta areas in ThioS-positive (ThioS+) or -negative (ThioS−) cells under control (DMSO) or bafilomycin A1 treatment (200 nM, 16 h) (n ≥ 60 cells each). (c) Representative fluorescence images of ThioS and p-ULK1 (Ser555) in MAPT-seeded MAPT-PL-V5-expressing HEK293 cells. Individual ThioS-positive cells are marked by a dotted line, and ThioS-negative cells are indicated by a white asterisk. (d) Quantitative analysis of p-ULK1 (Ser555) intensity in ThioS-positive (ThioS+) vs. -negative (ThioS−) cells (n ≥ 40 cells each). (e) Representative fluorescence images of ThioS and ULK1 in MAPT-seeded MAPT-PL-V5-expressing HEK293 cells. Individual ThioS-positive cells are marked by dotted lines, and a ThioS-negative cell is indicated by a white asterisk. (f) Quantitative analysis of ULK1 intensity in ThioS-positive (ThioS+) vs. -negative (ThioS−) cells (n = 38 cells each). Scale Bar: 20 μm. All data are expressed as mean ± SEM. NS, non-significant; *P ≤ 0.05.
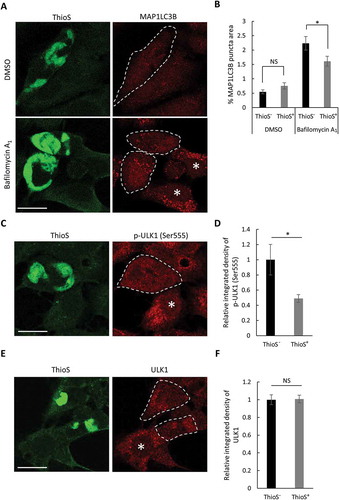
Figure 6. Overexpression of SQSTM1 reduces mutant MAPT pathology. (a) Representative western blots of AT8, CP13, and PHF1 (p-MAPT), Tau1 (unphosphorylated MAPT), and total MAPT in insoluble, soluble and total lysates of rTg4510 brains injected with AAV-GFP or AAV-SQSTM1. TUBG was used as a loading control. (b) Quantification of relative levels of mutant MAPT proteins:TUBG. n = 5/group for fractionated samples and n = 8/group for total lysates. (c) Representative immunofluorescence images of the cortex and hippocampus using the CP13 antibody. (d) Quantification of CP13-positive areas in (c). n = 4/group. (e) Representative GFAP and AIF1 immunofluorescence images of rTg4510 mice injected with AAV-GFP or AAV-SQSTM1. (f and g) Quantification of GFAP and AIF1/Iba1 immunoreactivity in (e). n = 4/group. Scale Bar: 500 μm in (c); 200 μm in (e). All data are expressed as mean ± SEM. NS, non-significant; *P ≤ 0.05; **P ≤ 0.01; ***P ≤ 0.001.
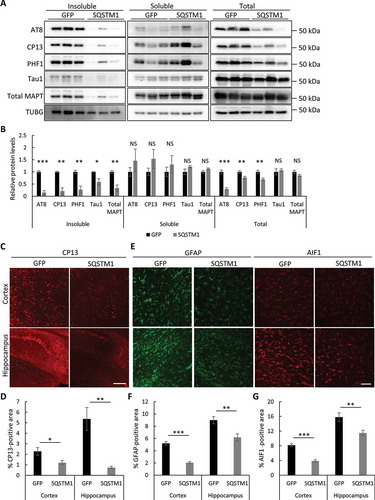
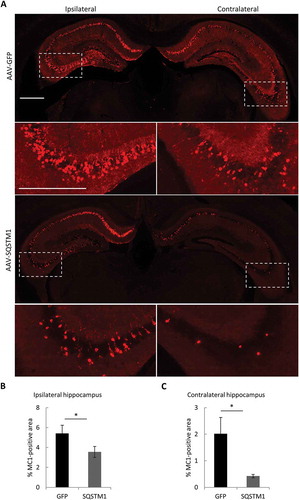
Figure 7. Overexpression of SQSTM1 attenuates pathological MAPT spreading. PS19 P0 pups were injected with AAV-GFP or AAV-SQSTM1, and at 2–3 months of age, 2 μl of MAPT brain lysate were stereotaxically injected into one hippocampal hemisphere (bregma, −2.5 mm; lateral, −2 mm, and depth, −1.8 mm). The mice were euthanized 2 months later for mutant MAPT spreading analysis. (a) Representative MC1-positive immunofluorescence images of ipsilateral and contralateral of hippocampus of PS19 mice injected with AAV-GFP or AAV-SQSTM1 and inoculated with MAPT lysates. The higher magnification views of bracketed areas are shown underneath each panel. (b and c) Quantitative analysis of MC1-positive areas in ipsilateral (b) or contralateral (c) hippocampus of AAV-GFP- or AAV-SQSTM1-treated PS19 mice. n = 9/group. Scale Bar: 1000 μm. Data are expressed as mean ± SEM. *P ≤ 0.05.