Figures & data
Figure 1. RAB30 is required for the recruitment of TGN-derived elements into GcAVs. (a) HeLa cells expressing EmGFP-RAB30 were infected with GAS for 3 h, fixed and immunostained with an anti-TGOLN2 antibody. (b) Pearson’s coefficient quantified for RAB30-TGOLN2 colocalization in noninfected (NI) or GAS-infected cells. Data represent means ± SD of 3 independent experiments (> 20 cells analyzed per condition). NS, not significant. (c) HeLa cells expressing EmGFP-LC3 were infected with GAS JRS4 for 4 h and fixed. After permeabilization, cells were stained using an anti-TGOLN2 antibody, and cellular and bacterial DNA was stained with DAPI. Images were captured using confocal microscopy. (d) HeLa cells expressing EmGFP-PLEKHA3, a resident of the TGN, were infected with GAS for 4 h. (e) HeLa cells transfected with a control siRNA or RAB30 siRNA were analyzed by immunoblotting. (f) HeLa cells were transfected with a control siRNA or RAB30 siRNA, as well as EmGFP-LC3 expression vector and then infected with GAS for 4 h. Cells were then fixed, permeabilized, and stained using an anti-TGOLN2 antibody. Bars: 10 μm. (g) Quantification of TGOLN2-positive GcAVs in control and RAB30 knockdown (KD) cells. Data represent the mean value ± SD from 3 independent experiments (> 50 GcAVs analyzed per condition). (h) HeLa WT or ATG5 knockout (KO) cells were transfected with a control siRNA or RAB30 siRNA. Two days after transfection, cells were infected with GAS for 2 and 6 h. The number of invading and surviving bacteria was measured in the GAS viability assay. *P < 0.05, **P < 0.01.
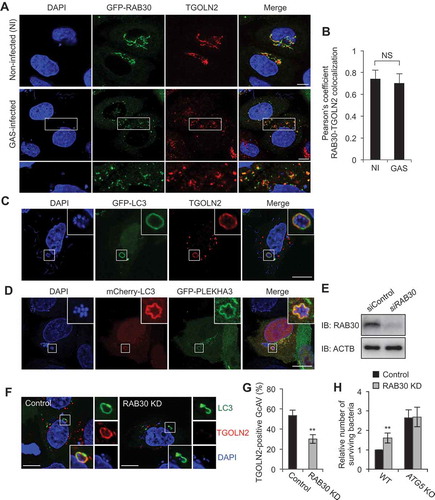
Figure 2. GcAVs contain PtdIns4P. (a) HeLa cells expressing EmGFP-OSBP-PH were infected with GAS for 4 h and immunostained with anti-TGOLN2 antibody. (b) HeLa cells expressing EmGFP-OSBP-PH and mCherry-LC3 were infected with GAS for 4 h. (c) HeLa cells expressing mCherry-LC3 were infected with GAS for 4 h and immunostained with anti-PtdIns4P antibody. Bars: 10 μm. NI, noninfected.
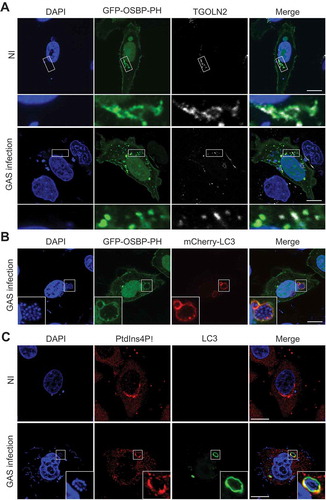
Figure 3. PtdIns4P is important for autophagy during GAS infection. (a) Schematic representation of pathways for PtdIns3P and PtdIns4P synthesis and drugs targeting enzymes involved in these pathways. (b) HeLa cells expressing EmGFP-LC3 were treated with wortmannin (Wm) or PAO, and infected with GAS for 4 h. Bars: 10 μm. (c) HeLa cells expressing EmGFP-LC3 were treated with Wm or PAO at the indicated concentrations, and infected with GAS for 4 h. The percentages of GcAV-positive cells were quantified. (d) HeLa cells were treated with Wm (5 μM) or PAO (200 nM), and infected with GAS. Cells were analyzed by immunoblotting. (e) HeLa cells expressing EmGFP-LC3 were incubated with Wm (5 μM) and loaded with exogenous PtdIns4P, and infected with GAS for 4 h. The percentages of GcAV-positive cells were quantified. (f) HeLa cells treated with Wm or PAO at the indicated concentrations were infected with GAS for 2 and 6 h. The number of invading and surviving bacteria was measured in the GAS viability assay. Data in (c), (e), and (f) are the mean ± SD of 3 independent experiments. hpi, hours post infection.
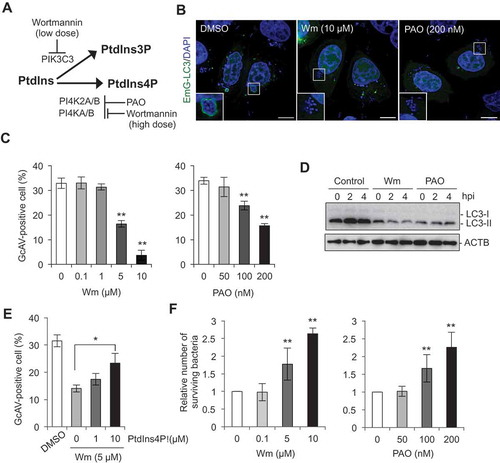
Figure 4. PI4KB is involved in GcAV formation. (a) HeLa cells expressing mCherry-LC3 and EmGFP-PI4Ks (PI4K2A, PI4K2B, PI4KA, or PI4KB) were infected with GAS for 4 h. Cells were fixed and stained with DAPI. Bars: 10 μm. (b) Immunoblot analysis of PI4K knockdown in HeLa cells. (c) HeLa cells transfected with mCherry-LC3 and the indicated siRNA were infected with GAS for 4 h. The percentages of cells with GcAVs were quantified. Data are the mean ± SD of 3 independent experiments (> 200 cells were analyzed per condition).
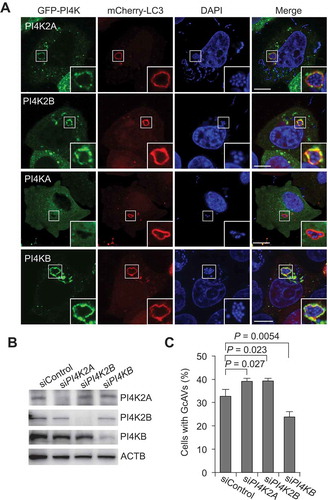
Figure 5. PI4KB colocalizes and interacts with RAB30. (a and b) HeLa cells expressing mCherry-RAB30 and EmGFP-PI4K (PI4K2A, PI4K2B, or PI4KB). Representative confocal images (a) and Pearson’s coefficient quantified for RAB30-PI4K colocalization (b). Bars: 10 μm. (c) HEK293T cells transfected with plasmids encoding EmGFP-RAB30 and FLAG-empty vector or FLAG-PI4KB were subjected to immunoprecipitations (IP) with an anti-FLAG antibody. The immunoprecipitated proteins and whole cell lysates (WCL) were analyzed by immunoblotting with anti-FLAG and anti-GFP antibodies. (d) HEK293T cells transfected with EmGFP-PI4KB and FLAG-empty vector, FLAG-RAB30, FLAG-RAB30 TN, or FLAG-RAB30 QL were subjected to immunoprecipitations with an anti-FLAG antibody. The immunoprecipitated proteins and whole cell lysates were analyzed by immunoblotting with anti-FLAG and anti-GFP antibodies. (e) The graph indicates a quantification of the amount of PI4KB in immunoprecipitation samples in (d). Data in (b) and (e) are the mean ± SD of 3 independent experiments.
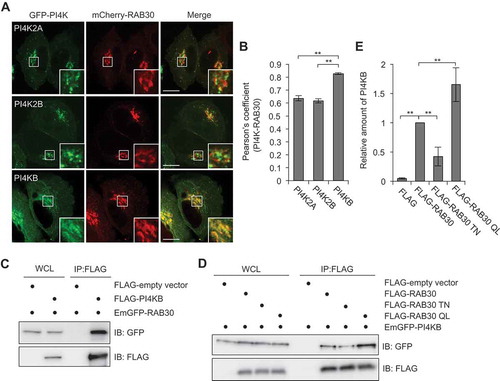
Figure 6. RAB30 is involved in the recruitment of PI4KB to TGN and GcAV. (a and b) HeLa cells were transfected with EmGFP-PI4KB and a control siRNA or RAB30 siRNA. After 2 d transfection, cells were fixed and immunostained using anti-TGOLN2 antibody. Representative confocal images (a) and proportion of TGOLN2-signals colocalized with EmGFP-PI4KB from at least 30 randomly selected fields were quantified using Mander’s coefficient M1 in control and RAB30-knockdown cells (b). (c and d) HeLa cells were transfected with mCherry-LC3, EmGFP-PI4KB and a control siRNA or RAB30 siRNA. After 2 d transfection, cells were infected with GAS for 4 h. Representative confocal images (c) and the percentages of PI4K-positive GcAV. Data in (b) and (d) are the mean ± SD of 3 independent experiments. Bars: 10 μm.
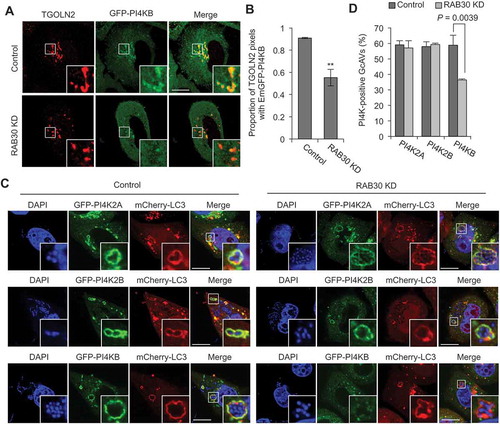
Figure 7. PI4KB is required for autophagy against GAS. (a) Immunoblot analysis of PI4KB knockout (KO) in HeLa cells. (b) HeLa WT or PI4KB KO cells were infected with GAS for 1 and 2 h. The number of invading bacteria was measured in the GAS viability assay. (c and d) HeLa wild-type (WT) and PI4KB-knockout (KO) cells were transfected with mCherry-LC3 and infected with GAS for 4 h. Representative confocal images (c) and quantification of GcAV-positive cells (d). Data are the mean ± SD of 3 independent experiments (> 200 cells were analyzed per condition). Bars: 10 μm. (e) HeLa WT or PI4KB KO cells were infected with GAS for 2 and 6 h. The number of surviving bacteria was measured in the GAS viability assay. Data in (b), (c), and (d) are the mean ± SD of 3 independent experiments.
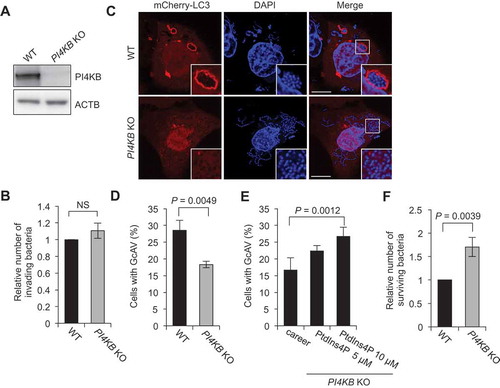
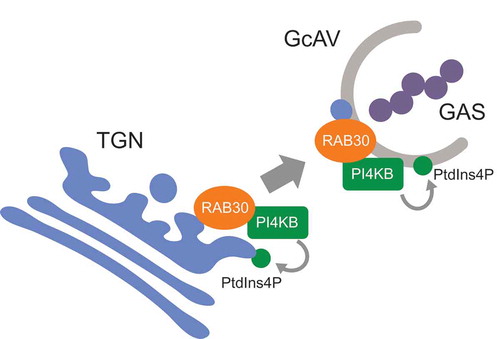
Figure 8. Proposed model of RAB30-mediated PI4KB regulation and GcAV formation.