Figures & data
Figure 1. Generation of mice lacking the WD and linker domains of ATG16L1. (A) Domain structure of ATG16L1. The N-terminal ATG5 binding domain (ATG5 b) binds the ATG12–ATG5 conjugate. The coiled-coil domain (CCD) binds WIPI2 through glutamates E226 and E230. A linker domain separates the CCD from the 7 WD repeats of the WD domain. (B) Sites of stop codons. atg16l1E230; 2 stop codons were inserted into exon 6 immediately after glutamate E230 to preserve binding sites for WIPI2, but prevent translation of the linker and WD domain. atg16l1E226; an unexpected recombination inserted a glycine residue at position 228. (C) Tissue lysates were separated by SDS-PAGE and transferred to nitrocellulose membranes. Separate membranes sections were analyzed by western blot using antibody specific for ATG16L1.
Figure 2. Analysis of ATG16L1 complexes in liver by gel filtration. The cytosolic fraction of liver homogenates was separated by size-exclusion chromatography on an ENrichTMSEC 650 column. Fraction (0.5 ml) were analyzed by immunoblot for ATG16L1, ATG5 and WIPI2 as indicated. Void volume 10 ml. Migration and elution of molecular mass standards are shown (kDa).
Figure 3. Role played by WD and linker domains of ATG16L1 during autophagy and LC3-associated phagocytosis. (A) MEFs from mice lacking ATG16L (FL KO), atg16l1E226 (E226) and atg16l1E230 (E230) and appropriate littermate controls were incubated in complete media or HBSS for 2 h to induce autophagy. Cell lysates were analyzed by western blot using antibodies specific for the indicated proteins. (B) MEFs or skin fibroblasts (C) from atg16l1E226 (E226) and atg16l1E230 (E230) mice and littermate controls were incubated in complete media or HBSS for 2 h to induce autophagy. Cells were immunostained for endogenous LC3. (D) BMDMs from atg16l1E226 (E226) and atg16l1E230 (E230) and appropriate littermate controls were incubated with Pam3CSK4-coupled polystyrene beads for 1.5 h in complete medium to induce LAP, and immunostained for endogenous LC3 (green). Boxed regions highlighting internalized beads are enlarged and shown in the lower panel. Magnification 63X, scale bars: 10 µm.
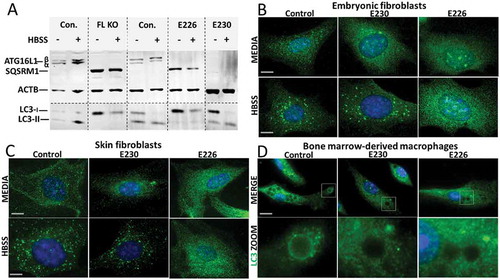
Figure 4. Phenotype of atg16l1E226 and atg16l1E230 mice. (A) Representative pictures of mice at ~2 months of age (scale bar: 1 cm). (B) Body weight of mice and littermate controls fed on chow diet. Mice were weighed at the indicted times and each point is generated from at least 6 individuals (n = 11 and 6 for E230 (atg16l1E230) and control, respectively; n = 11 and 8 for E226 (atg16l1E226) and control, respectively. Statistical analysis was done by unpaired t test. Error bars represents ±SEM. ****-P < 0.0001.
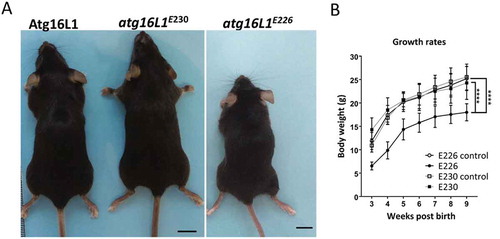
Figure 5. Analysis of autophagy substrates in liver. Panel (A) Representative livers at ~2 months (scale bar: 1 cm). (B) Liver weight expressed as a percentage of body weight at 2–3 months of age. E230 (atg16l1E230) n = 9, control n = 8; E226 (atg16l1E226) n = 9, control n = 7. (C) GPT/ALT in serum from mice aged between 2–3 months. E230 (atg16l1E230) n = 7, control n = 5; E226 (atg16l1E226) n = 5, v control n = 5. (D) Western blot of liver lysates from 3 representative mice. Membranes strips taken from the appropriate molecular weight range were analyzed separately using the indicted antibodies. (E) Representative histochemical sections of livers immunostained for SQSTM1. Enlarged regions of interest are shown in the lower panel. Arrows: SQSTM1 inclusions. In all figures data from littermate controls for E230 and E226 were pooled. Statistical analysis was done by unpaired t test. Error bars represents ±SEM. ****-P < 0.0001, ***-P < 0.001; ns, non-significant. Image magnification 40X, scale bars: 50 µm.
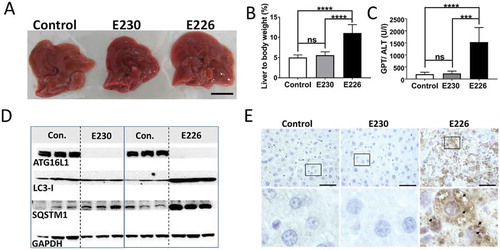
Figure 6. Analysis of liver homeostasis. (A) Representative images of H&E-stained sections of livers. Boxed regions of interest are enlarged in lower panels. The bar graph represents comparative circumferences of hepatocytes (n = 10) across the indicated strains (n = 3 for all the strains). (B and C) Representative histochemical sections of liver immunostained with antibodies against MKI67/Ki67 (B) or ITGAM/Cd11b (C). Regions of interest are enlarged and shown in lower panels. Arrows indicate positive staining. Bar graphs show number of positive cells (C) or percent positive cells (B). Five different zones for each liver section were analyzed (n = 3 for all the strains). Data across littermate control mice for E230 and E226 were pooled. Statistical analysis was done by unpaired t test. Error bars represents ±SEM. ****-P < 0.0001, *-P < 0.1. Magnification 20X, scale bars: 50 µm.
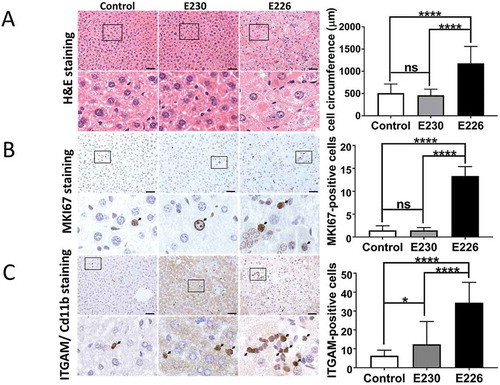
Figure 7. Analysis of muscle. (A) Gastrocnemius muscle weight expressed as a percentage of body weights at 2–3 months of age. E230 (atg16l1E230) n = 6, control n = 5; E226 (atg16l1E226) n = 8, control n = 6. (B) Western blot of muscle lysates from 3 representative mice. Membrane strips taken from the appropriate molecular weight range were analyzed separately by western blot using the indicted antibodies. (C) Bar graphs show levels of LC3 and SQSTM1 relative to GAPDH. (D) Histochemical sections of muscle were immunostained with antibodies against SQSTM1. Enlarged regions of interest are shown in the lower panels. Arrows: SQSTM1 inclusions. Statistical analysis was done by unpaired t test. Error bars represent ±SEM. ***-P < 0.001, **-P < 0.01; ns, non-significant. Magnification 20X, scale bar: 50 µm.
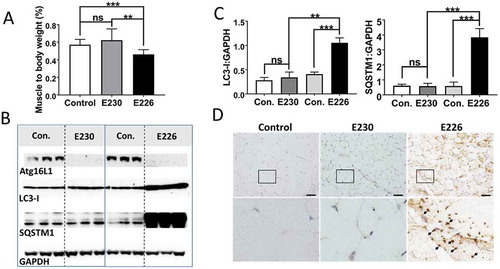
Figure 8. Analysis of kidney. (A) Kidney weights at 2–3 months expressed (i) directly: E230 (atg16l1E230 n = 8, control n = 8, E226 (atg16l1E226) n = 7, control = 8; or as (ii) percentage body weight: E230 (atg16l1E230 n = 9, control n = 8, E226 (atg16l1E226) n = 7, control = 6. (B) Western blot of kidney lysates from 3 representative mice. Membranes strips taken from the appropriate molecular weight range were analyzed separately using the indicted antibodies. (C) Bar graphs show levels of LC3 and SQSTM1 relative to GAPDH. (D) Histochemical sections of kidneys immunostained for SQSTM1. (G) Indicates glomerulus. Enlarged regions of interest are shown in lower panels. Arrows: SQSTM1 inclusions. Data from control mice were pooled. Statistical analysis was done by unpaired t test. Error bars represent ±SEM. ***-P < 0.001, **-P < 0.01; ns, non-significant. Magnification 20X, scale bars: 50 µm.
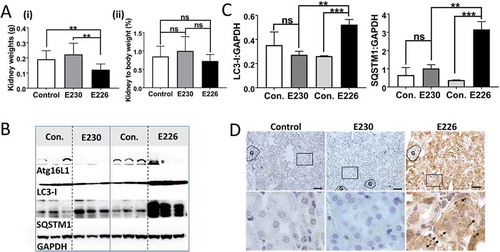
Figure 9. Analysis of brain. (A) Brain weights at 2–3 months expressed (i) directly: E230 (atg161E230 n = 8, control n = 7, E226 (atg16l1E226) n = 7, control = 7; or (ii) as percentage body weight: E230 (atg161E230 n = 8, control n = 9, E226 (atg16l1E226) n = 6, control = 5. (B) Western blot of brain lysates from 3 representative mice. Membrane strips taken from the appropriate molecular weight range were analyzed separately by western blot using the indicted antibodies. (C) Bar graphs show levels of LC3 and SQSTM1 relative to GAPDH. (D) Histochemical sections of brains were immunostained for SQSTM1. Enlarged regions of interest are shown in lower panels. Arrows indicate SQSTM1 inclusions. Data from control mice were pooled. Statistical analysis was done by unpaired t test. Error bars represents ±SEM. ***-P < 0.001, *-P < 0.1; ns, non-significant. Magnification 20X, scale bars: 50 µm.
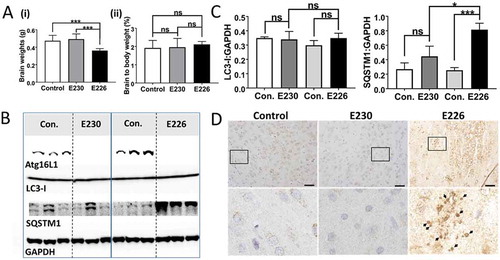
Figure 10. Analysis of ATG16L1 complexes in brain by gel filtration. The cytosolic fraction of brain homogenates was separated by size-exclusion chromatography on an ENrichTMSEC 650 column. Fraction (0.5 ml) were analyzed by immunoblot for ATG16L1, ATG5 and WIPI2 as indicated. Void volume 10 ml. Migration and elution of molecular mass standards are shown (kDa).