Figures & data
Figure 1. Mice carrying the ATG16L1T300A variant exhibit reduced UPEC persistence. (a) Schematic of the experimental setup. (b) Colony forming unit (CFU) counts of bacteriuria at 24 hpi plotted as mean of the Log10 value. n = 19 for WT; n = 45 for T300A; n = 6 experiments. ns, not significant by Mann-Whitney test. (c) CFU counts of the bladder plotted as mean ± SD of the Log10 value at 24 hpi. n = 5 for WT; n = 4 for T300A mice. ns, not significant by Mann-Whitney test. (d) Quantification of QIRs in WT and T300A bladders at 14 dpi. n = 8 sections/bladder, n = 17 mice for T300A, n = 45 mice for WT. *P < 0.05 by Mann-Whitney test. (e) IF image of a bacterial QIR. Bar: 10 µm.
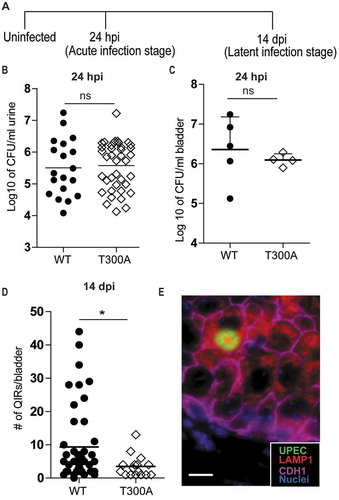
Figure 2. T300A mice exhibit superficial cell architectural changes. (a and b) IF imaging analysis of urothelium from WT (a) and T300A (b) mice. Green, vesicles; magenta, CDH1; blue, DAPI; red arrowhead, vesicular congestion. Bar: 10 µm. (c) Percentage of WT and T300A mice that showed vesicular congestion. (d and e) Representative TEM of superficial cell ultrastructure in WT (d) and T300A (e) mice. Red arrowhead, multi-vesicular bodies; blue arrow, lysosomes. Bar: 1 µm. (f and g) Quantification of MVBs (f) and lysosomes (g) in TEM images of urothelium from WT and T300A mice. Bars represent mean ± SEM. n = 3 mice/genotype.*P < 0.05 by unpaired two-tailed T test. (h and i) IF of UPK (green) in bladders of WT (g) and T300A (h) mice. Blue, DAPI. Bar: 10 µm.
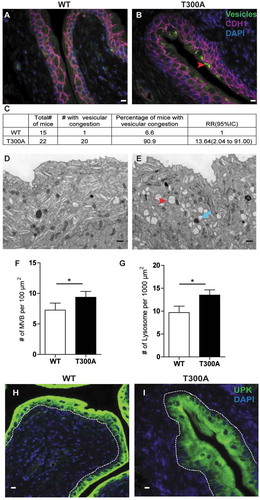
Figure 3. Loss of ATG16L1 or ATG7 but not ATG14 or EPG5 leads to decreased intracellular UPEC growth in human BECs. Quantification of intracellular UPEC CFU in human BECs treated with control siRNA and ATG16L1 siRNA (a), ATG7 siRNA (b), ATG14 siRNA (c) or EPG5 siRNA (d), Bars represent mean ± SD. *P < 0.05 by Mann-Whitney test, n = 3 replicates.
Figure 4. Loss of Atg16l1 or Atg7 in urothelium but not Atg14 or Epg5 leads to significant reduction in QIR formation. (a-d) CFU counts of bacteriuria at 24 hpi plotted as mean ± SEM of the Log10 value in Atg16l1fl/flUpk3a Cre− and Atg16l1fl/flUpk3a Cre+ mice (a), Atg7fl/flUpk3a Cre− and Atg7fl/flUpk3a Cre+ mice (b), Atg14fl/flUpk3a Cre− and Atg14fl/flUpk3a Cre+ mice (c) and WT and epg5−/- mice (d). ns, not significant by unpaired two-tailed T test. (e-h) Quantification of QIRs in Atg16l1fl/flUpk3a Cre− and Atg16l1fl/flUpk3a Cre+ bladders (e), Atg7fl/flUpk3a Cre− and Atg7fl/flUpk3a Cre+ bladders (f), Atg14fl/flUpk3a Cre− and Atg14fl/flUpk3a Cre+ bladders (g) and WT and epg5−/- bladders (h) at 14 dpi. n = 8 sections/bladder, n = 18–25 mice/genotype. Bar shows mean ± SD. *P < 0.05 by Mann-Whitney test; ns, not significant.
Figure 5. Loss of Atg16l1 or Atg7 but not Atg14 or Epg5 leads to urothelial architecture alterations. (a-d, 1 and 2) IF imaging analysis of urothelium from Atg16l1fl/flUpk3a Cre− and Atg16l1fl/flUpk3a Cre+ (A1-A2), Atg7fl/flUpk3a Cre− and Atg7fl/flUpk3a Cre+ (B1-B2), Atg14fl/flUpk3a Cre− and Atg14fl/flUpk3a Cre+ (C1-C2) and WT and epg5−/- mice (D1-D2). Green, vesicles; magenta, CDH1; blue, biz-benzimide DNA stain; red arrowhead, vesicular congestion. Bar: 10 µm. (A-D, 3 and 4) TEM of superficial cell ultrastructure in Atg16l1fl/flUpk3a Cre− and Atg16l1fl/flUpk3a Cre+ (A3-A4), Atg7fl/flUpk3a Cre− and Atg7fl/flUpk3a Cre+ (B3-B4), Atg14fl/flUpk3a Cre− and Atg14fl/flUpk3a Cre+ (C3-C4) and WT and epg5−/- mice (D3-D4). Red arrowhead, multivesicular bodies; blue arrow, lysosomes. n = 3 mice. Bar: 2 µm. (a-d, 5) Quantification of MVBs of Atg16l1fl/flUpk3a Cre− and Atg16l1fl/flUpk3a Cre+ mice (A5), Atg7fl/flUpk3a Cre− and Atg7fl/flUpk3a Cre+ mice (B5), Atg14fl/flUpk3a Cre− and Atg14fl/flUpk3a Cre+ mice (C5) and WT and epg5−/- mice (D5) urothelium. Bars represent mean ± SEM. (A-D, 6) Quantification of lysosomes of Atg16l1fl/flUpk3a Cre− and Atg16l1fl/flUpk3a Cre+ (A6), Atg7fl/flUpk3a Cre− and Atg7fl/flUpk3a Cre+ (B6), Atg14fl/flUpk3a Cre− and Atg14fl/flUpk3a Cre+ (C6) and WT and epg5−/- mice urothelium (D6). Bars represent mean ± SEM.
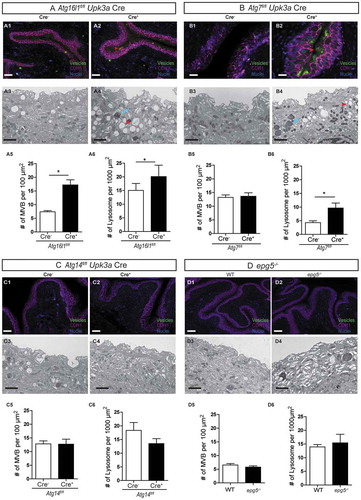
Figure 6. The ATG16L1T300A variant does not affect cytokine response to UPEC infection. (a-c) Western blot detection of CASP3 in whole bladder protein from WT and T300A mice before infection (a), 3 hpi (b), and 6 hpi (c). Numbers below the blots indicate densitometric quantification of the blots. (d) Neutrophil and monocyte counts in the urine at 24 hpi. n = 4–5 mice/genotype, n = 2 experiments. Bars represent mean ± SD. (e–g) Quantification of IL1B (e), IL6 (f), and TNF (g) levels produced by bone-marrow derived macrophages from WT and T300A mice at 24 hpi. (h–j) Quantification of Il1b (h), Il6 (i), and Tnf (j) mRNA levels in WT and T300A mouse bladders 24 hpi. Bars represent mean ± SD.
Figure 7. The ATG16L1T300A variant does not affect canonical autophagy response to UPEC infection. (a-b) Western blot detection of ATG16L1 and GAPDH (loading control) in whole bladder protein before infection (a) and 24 hpi (b). (c) Western blot detection of LC3 in whole bladder protein from fed and starved WT and T300A mice. (d) Western blot detection of LC3 in whole bladder protein from WT and T300A mice at 3 hpi. Numbers below the blots indicate densitometric quantification of the blots.
Figure 8. The presence of the T300A variant differentially regulates genes encoding RAB GTPases upon UPEC infection. (a) RT-qPCR analysis of mRNA levels of Rab27b, Rab11a, and Rab33b in bladders from WT and T300A mice before infection and 24 hpi. (b) Quantification of intracellular UPEC CFU in human BECs treated with vehicle and 3-PEHPC at the indicated time post infection. *P < 0.05; **P < 0.01 by Mann-Whitney test. (c) Quantification of intracellular UPEC CFU in human BECs treated with control siRNA and siRNAs directed against RAB33B, RAB27B, and RAB11A. *P < 0.05; **P < 0.01 by two-way ANOVA with Bonferroni post-test.
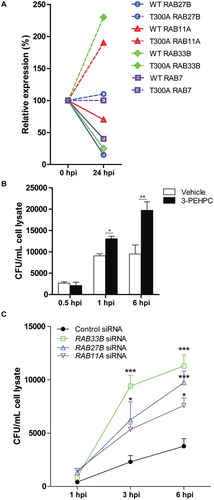
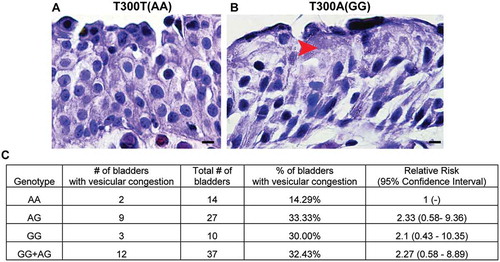
Figure 9. The ATG16L1T300A variant leads to superficial cell architectural alterations in human bladders. (a and b) Hematoxylin and eosin staining of human bladder tissue biopsies from participants carrying ATG16L1 rs2241880 AA (a) and GG (b) alleles. Red arrowhead, vesicles. (c) Percentage of human bladders of the indicated genotype that showed a vesicular congestion phenotype.