Figures & data
Figure 1. USP1 modulates ULK1 in mammalian cells. (a) U2OS cells were transfected with scrambled control siRNA or 3 different USP1-specific siRNAs. The relative amounts of each protein were quantified using ImageJ. The ratio of ULK1:ACTA1 and p-ULK1:ACTA1 was calculated and indicated in the graphs (b and c). (d) HEK-293, U2OS and MCF10AT cells were transfected with scrambled control or USP1-specific siRNA. After 72 h, samples were lysed in 1% Triton X-100-containing buffer and the cleared lysates utilized to monitor endogenous ULK1 and ULK1 p-Ser555 protein levels by western blot. The relative amounts of each protein were quantified using ImageJ. The ratio of ULK1:ACTA1 and pULK1:ACTA1 was calculated and indicated in the graphs (e and f). Filled arrow indicates full-length USP1; empty arrow indicates its autocleaved derivative. (g) U2OS cells were transfected with the indicated constructs. After 24 h the samples were lysed in 1% Triton X-100-containing buffer and, the cleared lysates utilized to monitor endogenous ULK1 and ULK1 p-Ser555 protein levels by western blot. The relative amounts of each protein were quantified using ImageJ and the ratio of ULK1:ACTA1 and p-ULK1:ACTA1 was calculated and indicated in the graphs (h and i).
Figure 2. USP1 modulates ULK1 in mammalian cells. (a) U2OS and (b) MCF10AT cells were transfected with scrambled or USP1-specific siRNA and 72 h later were incubated with 100 nM bortezomib for the indicated time intervals. The cleared lysates were utilized to monitor endogenous ULK1 and ULK1 p-Ser555 by immunoblot. The relative amounts of each protein were quantified using ImageJ. The ratio of ULK1:ACTA1 and p-ULK1:ACTA1 was calculated and indicated in the graphs (c and d) and (e and f).
Figure 3. USP1 depletion is coupled to a shift in ULK1 compartmentalization/solubility. (a, b and c) U2OS cells were silenced with scrambled or USP1-specific siRNA. After 72 h they were fixed and immunostained with anti-ULK1 antibody and analyzed by confocal laser scanning microscopy. (a) Representative images. Scale bar: 10 μm. (b) Quantification of the percentage of cells containing ULK1 aggregates. Data are means ± SD of 3 independent experiments *** = P < 0.0001; 50 cells per each condition were analyzed. (c) Control blot. (d) U2OS cells were transfected with scrambled or USP1-specific siRNA; 72 h later, 1% Triton X-100-soluble and -insoluble fractions were separated by centrifugation. Pellets were solubilized alternatively in 5 M urea- or in 2% SDS-containing buffers and analyzed by immunoblot with the indicated antibodies.
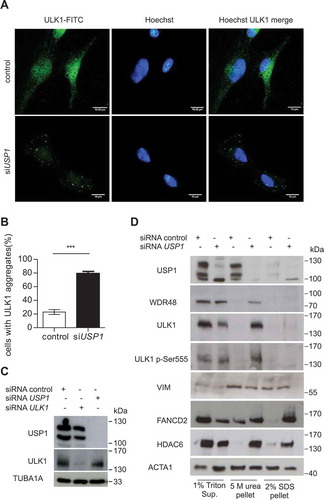
Figure 4. The USP1 inhibitor pimozide affects ULK1 compartmentalization/solubility. (a and b) U2OS cells were left untreated or incubated with 2.5 μM pimozide for the indicated time points, then fixed for immunofluorescence analysis with anti-ULK1 antibody and analyzed by confocal laser scanning microscopy. (a) Representative images, scale bar: 10 μm. (b) Quantification of cells with ULK1 aggregates. The graph reports the means ± SD of 3 independent experiments, at least 50 cells per group per experiment were counted. *** = P < 0.0001. (c) U2OS cells were left untreated or treated with 2.5 μM pimozide for the indicated time intervals. Next, 1% Triton X-100-soluble and -insoluble fractions were separated by centrifugation. Pellets were solubilized either with 5 M urea- or 2% SDS-containing buffers, and analyzed by immunoblot with the indicated antibodies.
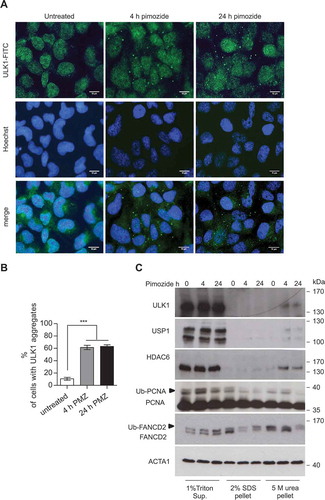
Figure 5. USP1 depletion is coupled to an increase in SQSTM1-ULK1 colocalization and enrichment of autophagic proteins in the 5 M urea-solubilized pellet. (a) Representative images of U2OS cells transfected with scrambled or USP1-specific siRNA and then fixed for immunofluorescence analysis with anti-SQSTM1- and -ULK1-specific antibodies. Scale bar: 10 μm. (b) Percentage of cells containing SQSTM1 dots. (c) Quantification of SQSTM1-ULK1 colocalization. Both graphs (b and c) report the mean ± SD of n = 3 independent experiments; at least 50 cells per group per experiment were counted. ** = P < 0.001 and *** = P < 0.0001. (d) Control blot. (e) U2OS cells were transfected with control, ULK1- or USP1-specific siRNA. After 72 h, the cells were left untreated or incubated with 100 nM of bortezomib for 6 h. Cleared lysates were immunoprecipitated with anti-ULK1 antibody and analyzed by immunoblotting with the indicated antibodies. (f) U2OS cells were transfected with scrambled or USP1-specific siRNA and were lysed after 72 h, in 1% Triton X-100-containing buffer. Detergent-soluble and insoluble fractions were separated by centrifugation and the pellets were solubilized either with 5 M urea-, or 2% SDS-based buffers and analyzed by immunoblots with the indicated antibodies.
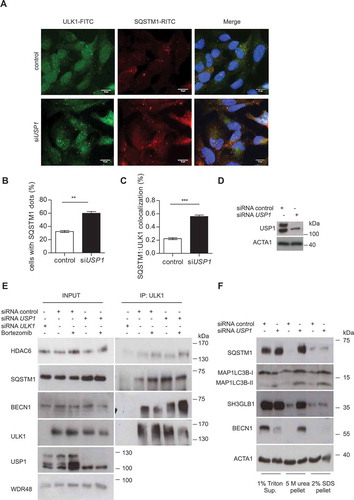
Figure 6. USP1 depletion increases BECN1-ULK1 and HDAC6-ULK1 colocalization. (a and b) U2OS cells were transfected with scrambled or USP1-specific siRNA and after 72 h with a plasmid encoding HA-ULK1. After 24 h, the cells were treated with rapamycin for 3 h and fixed for immunofluorescence analysis with anti-BECN1- and anti-HA-specific antibodies. (a) Representative images. Scale bar: 10 μm. (b) Quantification of BECN1-ULK1 colocalization. The graph reports the mean ± SD of n = 3 independent experiments; at least 50 cells per group per experiment were counted; ** = P < 0.001. (c and d) U2OS cells were transfected with scrambled or USP1-specific siRNA, and 72 h later, with a plasmid encoding HA-ULK1. After an additional 24 h, the cells were fixed for immunofluorescence analysis with anti-HDAC6- and anti-HA-specific antibodies. (c) Representative images. Scale bar: 10 μm. (d) Quantification of HDAC6-ULK1 colocalization. The graph reports the mean ± SD of n = 3 independent experiments; at least 50 cells per group per experiment were counted; ** = P < 0.001.
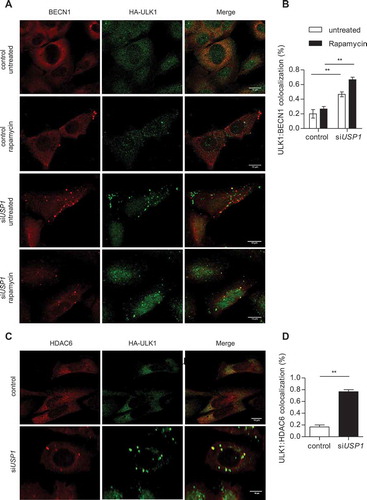
Figure 7. USP1 interacts with and deubiquitinates ULK1. (a) Control vector or a MYC-WDR48 (USP1 cofactor)-expressing plasmid were transfected into HEK293 cells. MBP was used as a transfection control. Cleared lysates were immunoprecipitated with anti-MYC antibodies and analyzed by immunoblot with the indicated antibodies. (b) Nuclear (N) and cytosolic (C) fractions were prepared from HEK293 cells and were subjected to immunoprecipitation (IP) with anti-IgG or anti-USP1 antibody. (c) U2OS cells transfected with scrambled or USP1-specific siRNA were left untreated or incubated with 0.5 μM rapamycin for 3 h. Cleared lysates were immunoprecipitated with anti-IgG or anti-ULK1 antibody and analyzed by immunoblot with the indicated antibodies. The arrow points towards the monoubiquitinated ULK1.
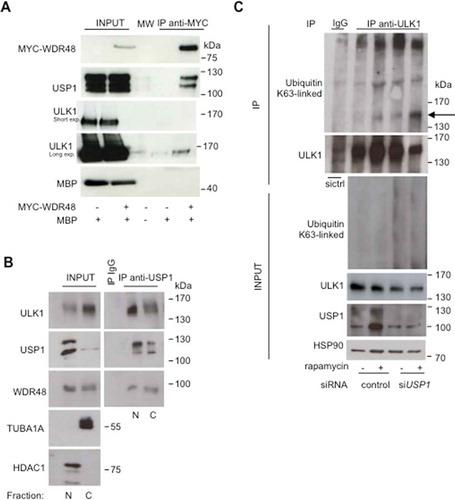
Figure 8. Canonical autophagy is impaired in USP1-depleted cells. (A-C) U2OS cells were transfected with scrambled control or USP1-specific siRNA. After 72 h, the cells were left untreated or treated with 0.5 μM rapamycin. After 3 h, the cells were fixed with paraformaldehyde, permeabilized with digitonin and analyzed by immunofluorescence with anti-MAP1LC3B antibody. (a) Representative images. Scale bar: 10 μm. (b) The graph reports the means ± SD of the number of MAP1LC3B puncta per cell. At least 50 cells for each condition in each experiment were analyzed. N = 3 independent experiments. *** = P < 0.0001, * = P < 0.05. (c) Control blot. (d) U2OS cells were transfected with control or USP1-specific siRNA. After 72 h, the cells were left untreated, or incubated with 0.5 μM rapamycin, or a cathepsin inhibitor cocktail (100 μM pepstatin A [Pep] and 10 μg/ml E64D), or a combination of rapamycin and cathepsin inhibitor cocktail for 3 h. Next, the detergent-soluble or – insoluble fractions were prepared and analyzed by immunoblot analysis with the indicated antibodies. The ratio of MAP1LC3B-II:ACTA1 was quantified using ImageJ and indicated in the graphs (e and f).
![Figure 8. Canonical autophagy is impaired in USP1-depleted cells. (A-C) U2OS cells were transfected with scrambled control or USP1-specific siRNA. After 72 h, the cells were left untreated or treated with 0.5 μM rapamycin. After 3 h, the cells were fixed with paraformaldehyde, permeabilized with digitonin and analyzed by immunofluorescence with anti-MAP1LC3B antibody. (a) Representative images. Scale bar: 10 μm. (b) The graph reports the means ± SD of the number of MAP1LC3B puncta per cell. At least 50 cells for each condition in each experiment were analyzed. N = 3 independent experiments. *** = P < 0.0001, * = P < 0.05. (c) Control blot. (d) U2OS cells were transfected with control or USP1-specific siRNA. After 72 h, the cells were left untreated, or incubated with 0.5 μM rapamycin, or a cathepsin inhibitor cocktail (100 μM pepstatin A [Pep] and 10 μg/ml E64D), or a combination of rapamycin and cathepsin inhibitor cocktail for 3 h. Next, the detergent-soluble or – insoluble fractions were prepared and analyzed by immunoblot analysis with the indicated antibodies. The ratio of MAP1LC3B-II:ACTA1 was quantified using ImageJ and indicated in the graphs (e and f).](/cms/asset/fc8fbff4-4827-4d11-b38c-a17d1f47e49a/kaup_a_1535291_f0008_c.jpg)
Figure 9. Noncanonical autophagy is hyperactive in USP1-depleted cells. (a-c) U2OS cells were silenced and treated as in , then fixed and permeabilized in ice-cold methanol for 5 min. Fixed cells were analyzed by immunofluorescence using anti-MAP1LC3B antibodies. (a) Representative images. Scale bar: 10 μm. (b) The graph reports the means ± SD of the number of MAP1LC3B puncta per cell. At least 50 cells per group per experiment were counted, n = 3 independent experiments. (c) Control western blot.
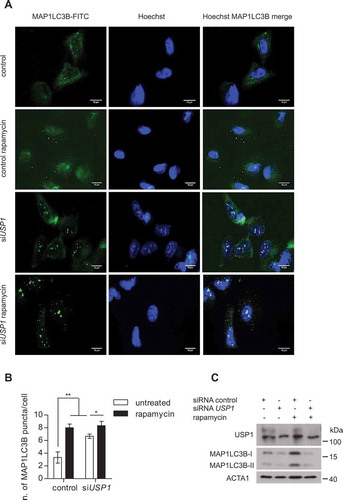
Figure 10. USP1 and LC3 proteins are expressed and significantly correlate in a subset of mammary tumors. (a and b) Representative images. Scale bars: 100 μm. (c) The table shows the number and percentage of USP1- and MAP1LC3B-positive samples for each group. Fisher’s exact test and Spearman’s test were performed in order to verify the correlation between USP1 and MAP1LC3B expression. P values and statistics are indicated for each group.
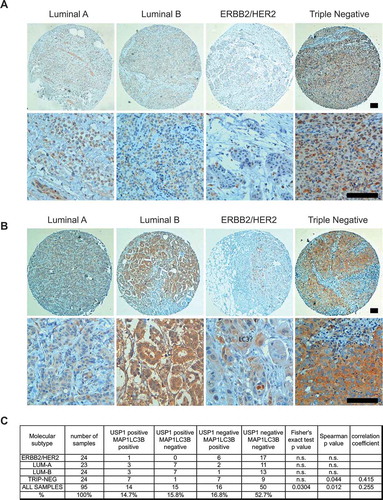
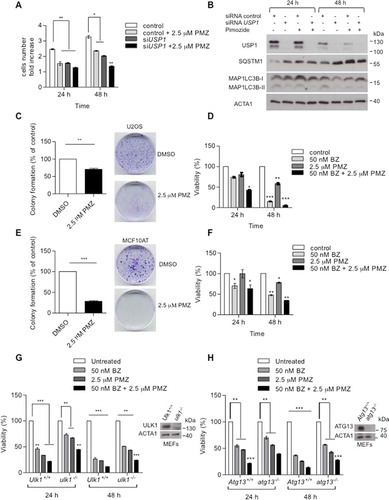
Figure 11. Pimozide affects cellular growth and colony-forming efficiency. (a and b) U2OS cells were transfected with scrambled or USP1-specific siRNA. After 72 h, the cells were either left untreated or grown in the presence of 2.5 μM pimozide (PMZ). Cells were counted at time 0, 24 and 48 h post drug addiction. (a) The graph indicates the means ± SD of cell number increase after 24 and 48 h with respect to time 0. N = 3 independent experiments. (b) Western blot analysis after 24 and 48 h of treatment for each condition to monitor USP1, MAP1LC3B and SQSTM1 levels. ACTA1 was used as loading control. (c) and (e) Effect of pimozide on colony formation assay in U2OS cells (c) or MCF10AT cells (e). Cells were treated with 2.5 μM pimozide for 2 wks, before processing. The graphs report the average colony-forming efficiency of 3 independent experiments. Colonies were counted using imageJ software; ** = P < 0.001 and *** = P = 0.0001. Representative images are shown at the right side of each graph. (d and f) U2OS (d) and MCF10AT (f) cells were left untreated, or treated with 50 nM bortezomib, 2.5 µM pimozide, or a combination of the 2 drugs. 24 and 48 h later, cell viability was measured by means of a fluorimeter after labeling with a commercial kit. The graph indicates the means ± SD, n = 3 independent experiments. Ulk1+/+ and ulk1−/- MEFs (g) or Atg13+/+ and atg13−/- MEFs (h) were left untreated, or treated with 50 nM bortezomib, 2.5 µM pimozide, or a combination of the 2 drugs. 24 and 48 h later, cell viability was measured by means of a fluorimeter after labeling with a commercial kit. The graphs indicate the means ± SD, n = 3 independent experiments.