Figures & data
Figure 1. Analysis of miRNAs from Flag-GRSF1-RIP deep sequencing. (a) Venn diagram of differential RNA enrichment in the Flag-GRSF1-RIP complex. (b) First nucleotide bias of the novel miRNAs. (c) Nucleotide bias at each position of the novel miRNAs. (d) Statistics of pathway enrichment in the Flag-GRSF1-RIP complex. (e) RT-qPCR showed the levels of G-miRNAs in HeLa cells. Experiments were performed 3 times, and data are presented as means ± SD.*P < 0.05; **P < 0.01; ***P < 0.001; ns, not significant.
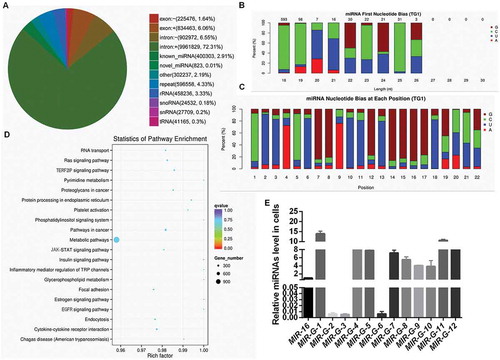
Figure 2. The novel miRNA MIR-G-1 is upregulated in cancer. (a) Prediction for the standard structure of pre-MIR-G-1. (b) The sequence of mature MIR-G-1-3p and MIR-G-1-5p. (C) RT-qPCR showed the level of MIR-G-1-3p and MIR-G-1-5p in HeLa and S12 cells. (d) Northern blot assay indicated that MIR-G-1 is existent in HeLa and C33A cells. (e) RT-qPCR showed the level of MIR-G-1-5p in diverse cancer cells. (f) RT-qPCR showed the level of MIR-G-1-5p in the serum of cervical cancer patients and normal people. (g) RT-qPCR showed the level of MIR-G-1-5p in tissues. Experiments were performed 3 times, and data are presented as means ± SD.*P < 0.05; **P < 0.01; ***P < 0.001; ns, not significant.
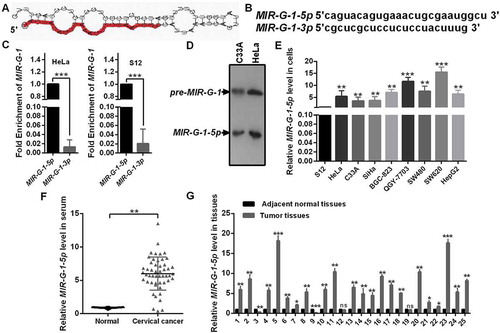
Figure 3. MIR-G-1 promotes cell proliferation and tumor growth, and inhibits apoptosis and anoikis. (a) MTT assay showed that overexpression of MIR-G-1 promoted cell viability. (b) Colony formation ability was higher after transfection with pri-MIR-G-1. Scale bar: 50 mm. (c) EdU assay was used to detect cell proliferation. Scale bar: 80 μm. (d) Flow cytometric cell cycle analysis showed that MIR-G-1 overexpression results in a significant decrease in the cellular population in the G0/G1 phase. (e) Representative graph of tumor size and the mean tumor weights 30 days after inoculation. (f) MKI67 expression in tissues was shown by IHC. Scale bar: 80 μm. (g) Flow cytometric apoptosis showed that MIR-G-1 overexpression significantly decreased the apoptosis rate in HeLa and C33A cells. (h) BCL2, cleavage of CASP3 and PARP expression level in the indicated plasmid-transduced HeLa cells after TAX (3 µg/ml) for 24 h was shown by western blot assay. (i) External cell morphology was analyzed using microscopy. Scale bar: 80 μm. (j) Western blot results for ITGB1, BCL2 and BAX in the indicated HeLa cells. Experiments were performed 3 times, and data are presented as means ±SD. *P < 0.05; **P < 0.01; ***P < 0.001; ns, not significant.
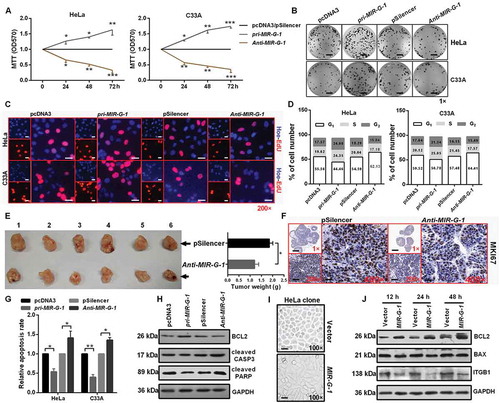
Figure 4. MIR-G-1 inhibits cell adhesion, promotes drug resistance, migration, invasion and nuclear autophagy. (a) Cell-matrix adhesion assay of HeLa and C33A cells at 90 min with overexpression or knockdown of MIR-G-1. Scale bar: 50 μm. (b) MIR-G-1 enhanced the drug resistance of HeLa cells to cis-platinum at 24 and 48 h. (c) Transwell assays showed that overexpression of MIR-G-1 promoted cell migration and invasion. Scale bar: 50 μm. (d) Western blot assay showed the protein levels of ICAM1, VIM and CDH1 after transfection with the indicated plasmids in HeLa cells. (e) Western blot assay showed the protein levels of LC3, SQSTM1 and BECN1 during starvation at 24 h after transfection with the indicated plasmids in HeLa cells. (f) IF showed the distribution of endogenous LC3 in HeLa cells during starvation at 24 h after transfection with the indicated plasmids. Scale bar: 20 μm. (g-h) IF showed the distribution of endogenous and exogenous LC3 in HeLa cells during starvation at 0, 12, 24, 36, and 48 h. Scale bar: 20 μm. (i) EGFP intensity showed the distribution of the exogenous EGFP-LC3 in HeLa cells during starvation at 0, 12, 24, 36, and 48 h. Scale bar: 20 μm. Experiments were performed 3 times, and data are presented as means ± SD. *P < 0.05; **P < 0.01; ***P < 0.001; ns, not significant.
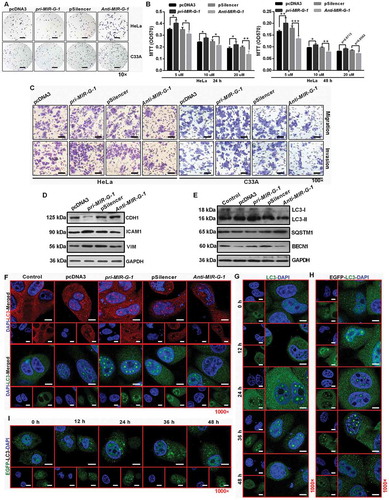
Figure 5. MIR-G-1 targets TMED5 and LMNB1 in cervical cancer. (a) EGFP reporter assay showed cells that were cotransfected with the indicated 3ʹUTR and pri-MIR-G-1 or pcDNA3. (b) EGFP reporter assay showed cells that were cotransfected with the indicated 3ʹUTR and anti-MIR-G-1 or pSilencer. (c) Western blot showed the EGFP protein level for cells transfected with the indicated plasmids. (d) EGFP reporter assay showed cells that were cotransfected with the indicated 3ʹUTR-mut and pri-MIR-G-1 or pcDNA3, anti-MIR-G-1 or pSilencer. (e) IF showed the distribution and expression of TMED5 and LMNB1 in HeLa cells transfected with the indicated plasmids. Scale bar: 20 μm. (f) Western blot assay showed the expression levels of TMED5 and LMNB1 in HeLa cells transfected with the indicated plasmids. (G) Western blot assay showed the expression levels of TMED5 and LMNB1 in subcutaneous xenotransplanted tumor tissues. (h) IHC showed the expression levels of TMED5 and LMNB1 in subcutaneous xenotransplanted tumor tissue. Scale bar: 50 μm. Experiments were performed 3 times, and data are presented as means ± SD.*P < 0.05; **P < 0.01; ***P < 0.001; ns, not significant.
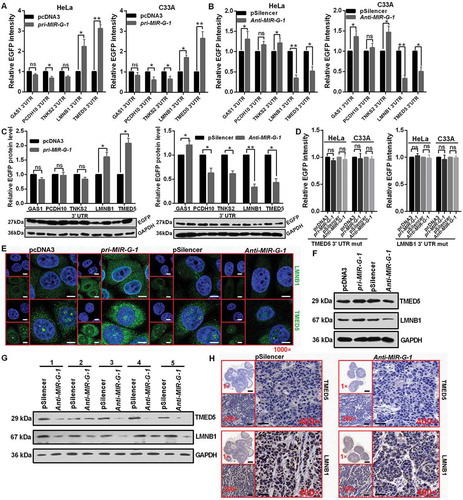
Figure 6. TMED5 promotes a cervical cancer cell malignant phenotype. (a) MTT assay showed that TMED5 overexpression promoted cell viability. (b) Colony formation ability was higher after transfection with pTMED5. Scale bar: 50 mm. (c) EdU assay was used to detect cell proliferation. Scale bar: 80 μm. (d) Flow cytometric cell cycle analysis showed that overexpression of TMED5 results in a significant increase in the cellular population in the G2/S phase in HeLa and C33A cells. (e) Flow cytometric apoptosis showed that overexpression of TMED5 significantly decreased the apoptosis rate in HeLa and C33A cells. (f) Western blot assay showed that the BCL2, cleavage of CASP3 and PARP expression level in the indicated plasmid-transduced HeLa cells after TAX (3 µg/ml) for 24 h. (g) Transwell assays showed that overexpression of TMED5 promoted cell migration and invasion. Scale bar: 50 μm. (h) Western blot assay showed the protein levels of ICAM1, VIM and CDH1 after transfection with the indicated plasmids in HeLa cells. (i) TMED5 overexpression enhanced the drug resistance of HeLa cells to cis-platinum at 24 and 48 h. (j) IHC showed the expression level of TMED5 in human tumor tissues in different clinical stages. Scale bar: 50 μm. Experiments were performed 3 times, and data are presented as means ±SD. *P < 0.05; **P < 0.01; ***P < 0.001; ns, not significant.
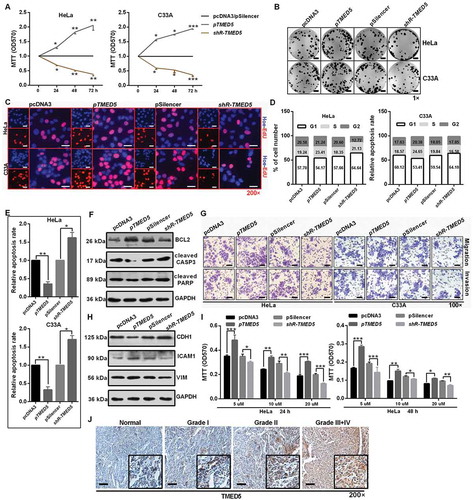
Figure 7. Interaction of TMED5 and WNT7B activates the WNT-CTNNB1/β-catenin pathway. (a) STRING showed the predicted interacting proteins of TMED5. (b) IF assay showed the overlapping distribution of TMED5 and WNT7B in HeLa cells. Scale bar: 50 μm. (c) IP assay showed the interaction of TMED5 and WNT7B in HeLa cells. (d-e) Western blot assay showed the expression levels of TMED5 and WNT7B in HeLa cells transfected with the indicated plasmids. (f) IF assay showed the distribution of CTNNB1 in HeLa cells transfected with the indicated plasmids. Scale bar: 80 μm. (g) Western blot assay showed the expression levels of total-CTNNB1, active-CTNNB1, CCND1, MYC and MT-CO2/COX2 in HeLa cells transfected with the indicated plasmids. (h) Top/Fop luciferase reporter assay was performed to detect the WNT activity. (i) IHC showed the expression levels of CTNNB1 in subcutaneous xenotransplanted tumor tissue. Scale bar: 50 μm. Experiments were performed 3 times, and data are presented as means ± SD. *P < 0.05; **P < 0.01; ***P < 0.001; ns, not significant.
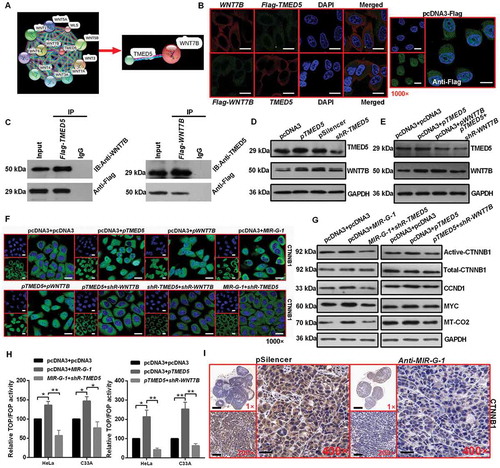
Figure 8. MIR-G-1 plays an oncogenic role in cervical cancer by regulating WNT7B expression. (a-c) Overexpression of WNT7B promoted cell proliferation. Scale bar: 50 mm. (d) Overexpression of WNT7B promoted cell cycle progression. (e-f) Overexpression of WNT7B inhibited apoptosis. (g-h) Overexpression of WNT7B promoted migration, invasion and EMT progression. Scale bar: 50 μm. (i) Overexpression of WNT7B promoted drug resistance. (j) IHC showed the expression levels of WNT7B in subcutaneous xenotransplanted tumor tissue. Scale bar: 50 μm. Experiments were performed 3 times, and data are presented as means ±SD.*P < 0.05; **P < 0.01; ***P < 0.001; ns, not significant.
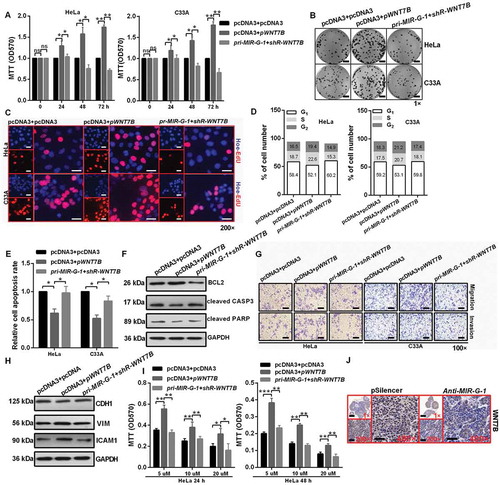
Figure 9. MIR-G-1 plays an oncogenic role in cervical cancer cells by regulating LMNB1expression. (a) IF assay showed the expression levels of LMNB1 and LC3 in HeLa cells during starvation at 24 h treated with the indicated plasmids. Scale bar: 20 μm. (b) Western blot assay showed the expression levels of LC3, SQSTM1, BECN1 and LMNB1 during starvation at 24 h after transfection with the indicated plasmids in HeLa cells. (c) Comet assays showed the degree of DNA breaks in HeLa cells transfected with the indicated plasmids treated with 10 µg/ml TAX for 4 h. Scale bar: 50 μm. (d) RT-qPCR showed the mRNA levels of TP53BP1 and H2AFX in HeLa cells transfected with the indicated plasmids under 10 µg/ml TAX treatment at 4 h in HeLa cells. (e) IF assay showed the TP53BP1 and H2AFX foci in HeLa cells tansfected with the indicated plasmids and treated with 10 µg/ml TAX for 4 h. Scale bar: 20 μm. Experiments were performed 3 times, and data are presented as means ±SD.*P < 0.05; **P < 0.01; ***P < 0.001; ns, not significant.
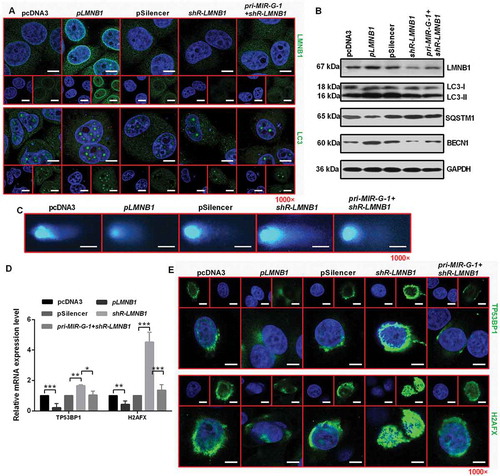
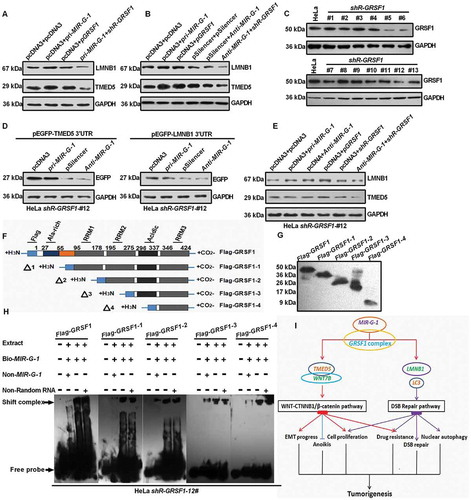
Figure 10. MIR-G-1 upregulates TMED5 and LMNB1 in a GRSF1-dependent manner. (a-b) Western blot assay showed the expression levels of TMED5 and LMNB1 transfected with the indicated plasmids in HeLa cells. (c) Western blot assay showed the expression levels of GRSF1 after treatment with the shR-GRSF1 technology in HeLa cells. (d) Western blot assay showed the EGFP protein levels in #12 shR-GRSF1 HeLa cells transfected with the indicated plasmids. (e) Western blot assay showed the expression levels of TMED5 and LMNB1 in #12 shR-GRSF1 HeLa cells transfected with the indicated plasmids. (f-g) GRSF1 mapping fragments were shown and identified by western blot assay. (h) RNA EMSA assay showed the interaction of GRSF1 or GRSF1-1 or GRSF1-2 or GRSF1-3 or GRSF1-4 and MIR-G-1. (i) The diagram of MIR-G-1 upregulating TMED5 and LMNB1 to promote malignancy and nuclear autophagy in cervical cancer cells. Experiments were performed 3 times, and data are presented as means ± SD.*P < 0.05; **P < 0.01; ***P < 0.001; ns, not significant.