Figures & data
Figure 1. HDAC6 inhibition or KD inhibits the proliferation of cancer stem cells. (a and b) NT2/D1 and P19 tubastatin A-treated cells were stained with trypan blue and counted to determine the number of viable cells after 48, 72 and 96 h treatment. (c and d) NT2/D1 and P19 HDAC6 KD cells were stained with trypan blue and counted to determine the number of viable cells after 48, 72 and 96 h transfection. (e and f) NT2/D1 and P19 tubastatin A-treated cells were stained with MTS reagent and the percentage of proliferation was determined after 24 h. (g and h) NT2/D1 and P19 HDAC6 KD cells were stained with MTS reagent (24 h) for proliferation evaluation. (i and m) NT2/D1, tubastatin A-treated cells were subjected to (i) WB and (m) qRT-PCR analysis for pluripotency factors (i.e., POUF51/Oct4, NANOG, SOX2). The numbers below the blots correspond to densitometry quantification of blots normalized to the loading control. (j and n) P19 tubastatin A-treated cells were subjected to (j) WB and (n) qRT-PCR analysis for pluripotency factors (i.e. Pouf51/Oct4, Nanog, Sox2). (k and o) NT2/D1 HDAC6 KD cells were subjected to (k) WB and (o) qRT-PCR analysis for pluripotency factors (POUF51, NANOG, SOX2). (l and p) NT2/D1 HDAC6 KD cells were subjected to (l) WB and (p) qRT-PCR analysis for pluripotency factors (POUF51, NANOG, SOX2). Statistical analysis was performed with two-tailed, Student’s t-test with 95% confidence interval; *P-values = 0.05 obtained by comparing the respective data with the untreated or scrambled control. MFI, mean fluorescence intensity.
Figure 2. HDAC6 inhibition or KD promotes differentiation in NT2/D1 and P19 cells. (a and b) Micrographs of NT2/D1 KD or tubastatin A-treated cells evaluating the influence of HDAC6 KD (a) and tubastatin A treatment (b) on cell morphology. (c and d) NT2/D1 and P19 tubastatin A-treated cells were subjected to WB analysis for differentiation factors (TUBB3 and CSN2). The numbers below the blots correspond to densitometry quantification of blots normalized to the loading control. (e and f) NT2/D1 and P19 HDAC6 KD cells were subjected to WB analysis for differentiation factors (TUBB3/Tubb3 and CSN2). (g and h) qRT-PCR analysis for differentiation markers TUBB3, CSN2, SPP1, GATA6, TBXT/T and Cdx2 in tubastatin A-treated NT2/D1 and P19 cells. (i and j) NT2/D1 and P19 HDAC6 KD cells were subjected to qRT-PCR analysis for differentiation markers TUBB3, CSN2, SPP1, GATA6, TBXT/T and Cdx2. (k) NT2/D1 HDAC6 KD cells were subjected to WB analysis for differentiation marker ACTB. (l) NT2/D1 HDAC6 KD cells treated with or without MG132 for 4 h were subjected to WB analysis for differentiation marker ACTB. (m) NT2/D1 HDAC6 KD cells were subjected to immunoprecipitation (IP) using anti-ACTB antibody followed by WB analysis for specific ubiquitination of ACTB. Statistical analysis was performed with two-tailed, Student’s t-test with 95% confidence interval; *P-values = 0.05 obtained by comparing the respective data with the untreated or scrambled control.
Figure 3. HDAC6 inhibition or KD promotes autophagy in NT2/D1 and P19 cells. (a) NT2/D1 cells were pre-treated with caspase inhibitor V or necrostatin followed by treatment with tubastatin A and subjected to WB for POU5F1, NANOG, SOX2, and TUBB3. (b and c) Tubastatin A-treated NT2/D1 and P19 cells were treated with 18 µM chloroquine (CQ) and the levels of SQSTM1, and LC3B-II were analyzed by WB analysis. (d and f) NT2/D1 HDAC6 KD cells were subjected to WB analysis for ATG5, LC3A-II, LC3B-II and SQSTM1. (e and g) NT2/D1 and P19 cells with either scrambled control or shHDAC6 shRNA were treated with 18 µM chloroquine (CQ) and the levels of SQSTM1, and LC3B-II were analyzed by WB analysis. (h) NT2/D1 HDAC6 KD cells were transfected with a GFP-LC3 overexpressing plasmid and treated with chloroquine (CQ), and puncta formation was analyzed by confocal microscopy. Arrowheads indicate examples of GFP-LC3 puncta.
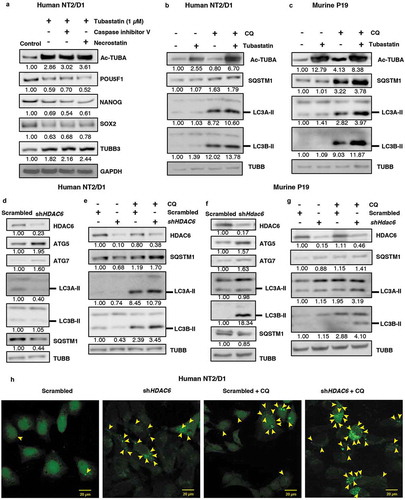
Figure 4. HDAC6 KD inhibits MTOR in NT2/D1 and P19 cells via the tuberous sclerosis complex. (a-d) NT2/D1 and P19 cells were subjected to western blot analysis for (a) p-MTOR, MTOR, (b) p-AKT, AKT, (c) TSC1, TSC2, (d) p-RPS6KB and p-EIF4EBP1. (e and f) NT2/D1 HDAC6 KD cells were treated with autophagy inducing agents Tat-Beclin or rapamycin for 24 h, stained with trypan blue and counted to determine the number of viable cells. (g and h) P19 HDAC6 KD cells were treated with autophagy-inducing agents Tat-Beclin or rapamycin for 24 h, stained with trypan blue and counted to determine the number of viable cells. (i) NT2/D1 retinoic acid-treated cells were subjected to WB for POU5F1. (j) POU5F1 KD cells were subjected to WB for HDAC6. (k) NT2/D1 (ATG7 or ATG12 KD) cells were subjected to WB analysis for HDAC6. Statistical analysis was performed with two-tailed, Student’s t-test with 95% confidence interval; *P-values ≤ 0.05 obtained by comparing the respective data with the untreated or scrambled control.
Figure 5. HDAC6 inhibition or KD decreases the viability and promotes apoptosis in MDA-MB-231 and MDA-MB-468 differentiated breast cancer cells. (a and c) Tubastatin A-treated MDA-MB-231 and MDA-MB-468 cells were stained with MTS reagent and proliferation was determined 24 h post treatment. (b and d) MDA-MB-231 and MDA-MB-468 HDAC6 KD cells were stained with trypan blue and counted to determine the number of viable cells after 24, 48 and 72 h transfection. Tubastatin A-treated or HDAC6 KD MDA-MB-231 (e and f) or MDA-MB-468 (g and h) cells were subjected to WB analysis for CASP3. Tubastatin A-treated or HDAC6 KD MDA-MB-231 (i and j) or MDA-MB-468 (k and l) cells were stained with ANXA5-7-AAD and then analyzed by flow cytometry for the detection of apoptotic cells. Statistical analysis was performed with two-tailed, Student’s t-test with 95% confidence interval; *P-values = 0.05 obtained by comparing the respective data with the untreated or scrambled control.
Figure 6. HDAC6 inhibition or KD inhibit autophagy in MDA-MB-231 and MDA-MB-468 cells. (a) MDA-MB-231 tubastatin A-treated cells were subjected to western blot analysis for ATG5, ATG7 LC3A-II, LC3B-II and SQSTM1 and treated with 18 µM chloroquine (CQ), and the levels of SQSTM1, and LC3-II were analyzed by WB analysis. (b) MDA-MB-231 HDAC6 KD cells were subjected to WB analysis for ATG5, ATG7, LC3A-II and LC3B-II and SQSTM1 and scrambled control or shHDAC6 KD cells were treated with 18 µM chloroquine (CQ) and the levels of SQSTM1, and LC3-II were analyzed by WB analysis. (c) MDA-MB-231 HDAC6 KD cells were transfected with GFP-LC3-overexpressing plasmid and treated with chloroquine (CQ) and puncta formation was analyzed by confocal microscopy. Arrowheads indicate examples of GFP-LC3 puncta. (d) MDA-MB-468 tubastatin A-treated cells were subjected to western blot analysis for ATG5, ATG7, LC3A-II, LC3B-II and SQSTM1 and treated with 18 µM chloroquine (CQ) and the levels of SQSTM1, and LC3-II were analyzed by WB analysis. (e) MDA-MB-468 HDAC6 KD cells were subjected to WB analysis for ATG5, ATG7, LC3A-II, LC3B-II and SQSTM1 and scrambled control or shHDAC6 KD cells were treated with 18 µM chloroquine (CQ) and the levels of SQSTM1, and LC3-II were analyzed by WB analysis. (f) MDA-MB-468 HDAC6 KD cells were transfected with GFP-LC3-overexpressing plasmid and treated with chloroquine (CQ) and puncta formation was analyzed by confocal microscopy.
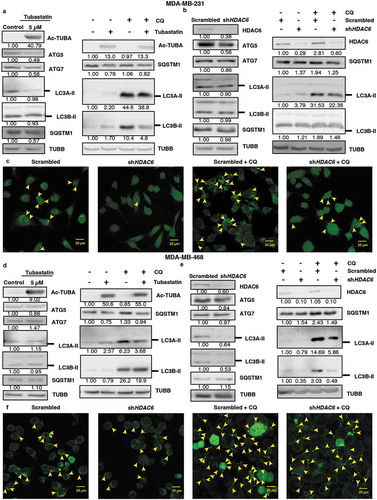
Figure 7. HDAC6 KD differentially regulates p-MTOR and the tuberous sclerosis complex in MDA-MB-231 and MDA-MB-468 breast cancer cells. (a-d) MDA-MB-231 and MDA-MB-468 cells were subjected to western blot analysis for (a) p-MTOR, MTOR, (b) p-AKT, AKT, (c) TSC1, TSC2, (d) p-RPS6KB and p-EIF4EBP1.
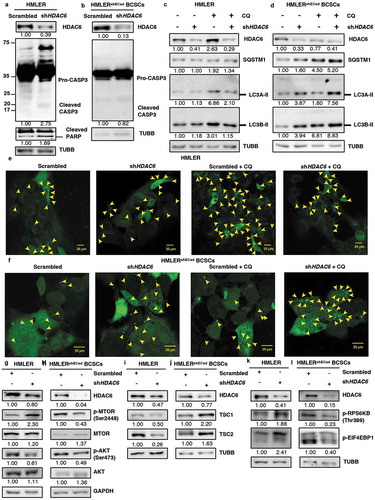
Figure 8. HDAC6 KD in HMLERshECad breast cancer stem cells (BCSCs) promotes autophagy by inhibition of p-MTOR via the tuberous sclerosis complex. (a) HMLER and (b) HMLERshECad HDAC6 KD cells were subjected to western blot analysis for Pro-CASP3 and cleaved CASP3. Numbers below the blots correspond to densitometry quantification of blots normalized to the loading control. (c) HMLER and (d) HMLERshECad cells with either scrambled control or shHDAC6 shRNA were treated with 18 µM chloroquine (CQ) and the levels of SQSTM1, and LC3-II were analyzed by WB analysis. (e) HMLER and (f) HMLERshECad HDAC6 KD cells were transfected with GFP-LC3-overexpressing plasmid and treated with chloroquine (CQ) and puncta formation was analyzed by confocal microscopy. Arrowheads indicate examples of GFP-LC3 puncta. (g) HMLER and (h) HMLERshECad HDAC6 KD cells were subjected to analysis for p-MTOR, MTOR, p-AKT and AKT. (i) HMLER and (j) HMLERshECad HDAC6 KD cells were subjected to analysis for TSC1 and TSC2. (k) HMLER and (l) HMLERshECad HDAC6 KD cells were subjected to analysis for p-RPS6KB and p-EIF4EBP1.