
Figures & data
Figure 1. Sensory epithelial cells were damaged in the cochlea of mice after kanamycin and furosemide administration. (a) Morphological changes of the hair cells in the cochlea of mice from the normal and experimental groups, as determined under a confocal microscope. Images were taken from the middle turn of cochlea. Con, normal mice without drug treatment. Three rows of outer hair cells and 1 row of inner hair cells in the cochlea of mice were neatly arranged, and no hair cells were lost. 30D, 30 days after drug administration. The arrangement of hair cells was unorganized, and hair cell loss was evident. (b and c) The density of the residual inner or outer hair cells in the middle turn of cochlea at each time point. *, Compared with that in the blank control group, the density of hair cells was significantly lower (P < 0.05). Data are represented as the means ± SD; n = 5. OHC, outer hair cell; IHC, Inner hair cell; red, MYO7A staining; blue, DAPI staining. Scale bar: 40 µm.
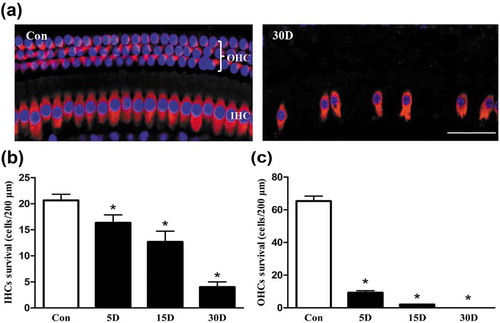
Figure 2. SGN degeneration in the cochlea of mice was successfully established following the destruction of cochlear sensory epithelial cells. (a) Morphological changes of SGNs (red circle) in the apical, middle, and basal turn of the cochlea from the normal and experimental group, as determined with HE staining under a light microscope. The quantified SGN density in each turn is shown on the right panel. In the experimental group, the SGN density progressively decreased. (b) Morphological changes of the organ of Corti taken from the middle turn of cochlea from the normal and experimental group. The sensory epithelial cells and tunnel of Corti were disrupted and collapsed in the experimental groups. *, compared with that in the blank control group, the SGN density was significantly lower (P < 0.05). Data are represented as the means ± SD; n = 6 for each time point. Con, normal mice without drug treatment; 30D, 30 days after the end of the drug administration. Scale bar: 100 µm.
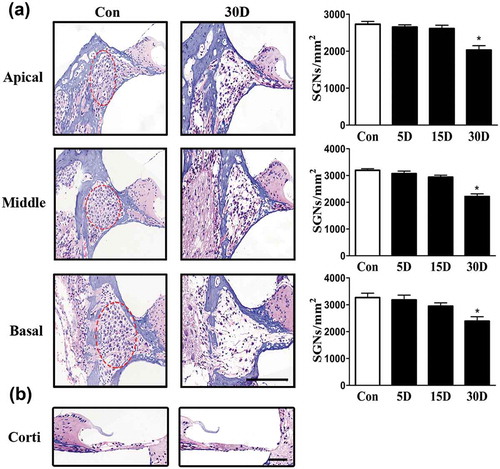
Figure 3. Ultrastructural observation of lipofuscins in the cochlear spiral ganglion neurons of mice. (a) Ultrastructure features of the SGNs in normal mice (8 w). (b) Thirty days after administration, lipofuscins (white arrows) of degenerated SGNs aggregated progressively. (c) Autophagic vacuole. (d) Intracellular inclusion body (white arrowhead) containing lipid droplets. (e) Enlarged and cristae-disrupted mitochondria. (f) The lipofuscin area in the degenerated SGN cytoplasm gradually increased with the progression of neurodegeneration. *, compared with that in the blank control group, the lipofuscin area within the degenerated SGN cytoplasm was significantly increased (P < 0.05); #, compared with that on the 5th day after ototoxic drug administration, the lipofuscin area within the degenerated SGN cytoplasm on the 15th day was significantly higher (P < 0.05); Δ, compared with the area at the previous observation point, the area of lipofuscin within the degenerated SGN cytoplasm was further increased by the 30th day after ototoxic drug administration (P < 0.05). Con, normal mice without drug treatment; 30D, 30 days after drug administration. Images of TEM were taken from the middle turn of cochlea. Scale bar: 1 µm.
Figure 4. Lipofuscin autofluorescence was increased during SGN degeneration in the cochleae of mice. (a) Lipofuscin autofluorescence within SGNs taken from the middle turn of cochlea in the blank control (Con) and experimental mice on the 30th day after ototoxic drug administration, as observed under a confocal microscope. Lipofuscin-like granules are represented as yellow dots in the merged panel. (b) Lipofuscin autofluorescence intensity within SGNs at each observation point. *, compared with that in the blank control group, the autofluorescence intensity in the degenerated SGNs was statistically increased (P < 0.05).; con normal mice without drug treatment; 30D, 30 days after drug administration. Scale bar: 50 µm.
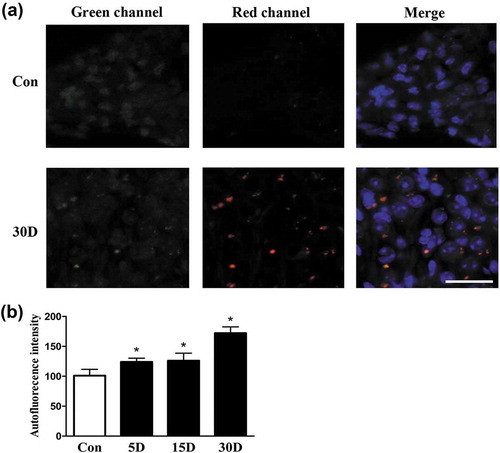
Figure 5. The autophagy level was increased in degenerated mouse SGNs. (a-c) Western blot results revealed that the levels of the autophagy-related proteins LC3 and BECN1 were increased in the degenerated SGNs on the 5th, 15th and 30th day after ototoxic drug administration and were significantly different from those in the normal mice. *, P < 0.05. (d) Immunofluorescence staining of LC3 puncta (red) also demonstrated that the LC3 level in the degenerated SGNs (green) was significantly increased on the 30th day after drug administration. Con, normal mice without drug treatment; 30D, 30 days after drug administration. Images of immunofluorescence staining were taken from the middle turn of cochlea. Scale bar: 10 µm.
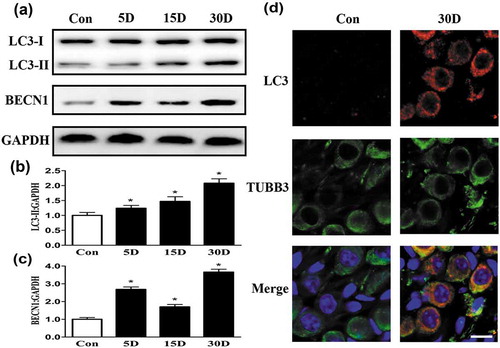
Figure 6. Autophagic flux and lysosomal hydrolase levels were impaired during the process of SGN degeneration in the cochlea of mice. (a and b) Western blot analysis revealed that levels of the autophagic cargo receptor protein SQSTM1 and ubiquitinated proteins were increased in SGNs on the 5th, 15th and 30th day after ototoxic drug administration. (c) Quantitative real-time PCR results revealed that compared with that in the blank control group, the Ctsd level was significantly decreased on the 5th day after the ototoxic drugs were given. By the 15th day, the levels of Lamp1, Ctsb and Ctsd were significantly lower in the treated mice than in the normal mice (P < 0.05). On the 30th day after ototoxic drug administration, the levels of Ctsd and Lamp1 were further decreased (P < 0.05). Gapdh was used as the internal reference. (d-f) Western blot assays revealed that the levels of LAMP1 and CTSD were significantly decreased with SGN degeneration compared with these levels in the blank control SGNs. *, P < 0.05; Con, normal mice without drug treatment; 5D, 15D, and 30D, 5, 15, and 30 days after drug administration, respectively.
Figure 7. TFEB nuclear translocation was promoted in the degenerated SGNs via MTOR pathway inhibition by CCI-779 intervention. (a and b) Western blot analysis revealed that the presence of TFEB in the nucleus of degenerated SGNs gradually decreased on the 5th, 15th and 30th day after ototoxic drug administration, while the TFEB level increased in the cytoplasm. (c and d) Compared with that of the blank control and negative control groups, the TFEB nucleus-to-cytoplasm distribution ratio was significantly higher in the degenerated SGNs of the experimental group based on western blot. (e and f) The p-MTOR level was significantly suppressed in the experimental group after the mice were treated with CCI-779. *, the difference between the blank control group and the negative control group was significant (P < 0.05); #, compared with the blank control or negative control group, the ratio was significantly increased in the experimental group (P < 0.05); CCI-779, experimental group; 30D, negative control group; con, blank control group.
Figure 8. CCI-779 significantly rescued the impaired autophagy-lysosomal pathway in degenerated SGNs of mice. (a) The levels of Ctsb, Ctsd, and Lamp1 and of the autophagic genes Becn1 and Lc3b were significantly higher, and Sqstm1 was lower in the experimental group than in the negative control group, which was determined by quantitative real-time PCR. (b and c) The LAMP1 and CTSD levels determined by western blotting were consistent with the quantitative real-time PCR results. (d and e) Compared with those in the negative control group, the LC3 and BECN1 levels in the experimental groups were significantly increased, as determined by western blot assays. (f and g) The western blot results revealed that the levels of the autophagic cargo receptor SQSTM1 and ubiquitinated proteins were decreased significantly in the experimental group compared with those in the negative control groups. *, the difference between the experimental group and the blank control group was significant (P < 0.05); #, the difference between the experimental group and the negative control group was significant (P < 0.05); CCI-779, experimental group; 30D, negative control group; Con, blank control group.
Figure 9. SGN degeneration was significantly attenuated with CCI-779 intervention. Light microscopy observation of toluidine blue staining revealed that SGN density in the apical, middle and basal turn of the experimental group was significantly higher than that of the negative control group but was still lower than that in the blank control group. *, the difference between the 2 groups was significant (P < 0.05); CCI-779, experimental group; 30D, negative control group; Con, blank control group. Scale bar: 50 µm.
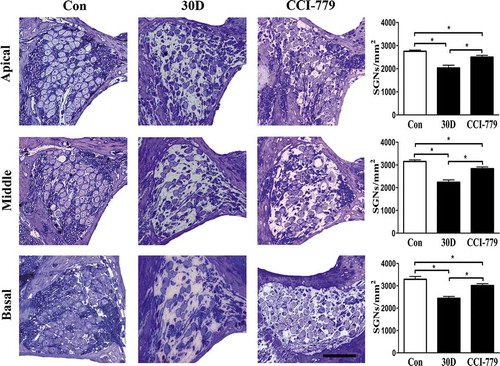
Figure 10. The degenerative rate of auditory nerve fibers was also significantly reduced with the CCI-779 intervention. (a and c) Compared with that of the negative control group, light microscopy observation of toluidine blue staining revealed that the nerve fiber density in the habenula perforata of the experimental group was significantly higher in the apical, middle and basal turns. (b) A diagram model of the calculated auditory nerve fiber density. The number of axons in the yellow box was counted. The size of the yellow box is 0.01 mm x 0.01 mm. The density of auditory nerve fibers (ANFs) was determined by the number of axons/100 μm2. *, the difference between the experimental group and the blank control group was significant (P < 0.05); #, the difference between the experimental group and the negative control group was significant (P < 0.05); CCI-779, experimental group; 30D, negative control group; Con, blank control group. Scale bar: 25 µm.
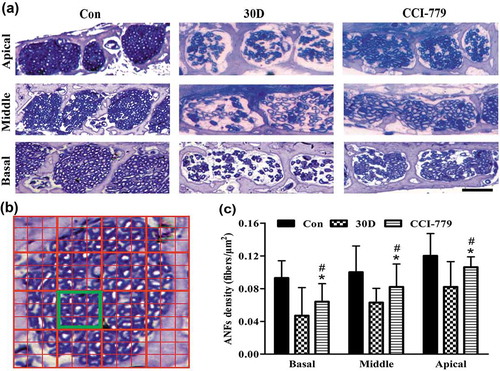
Figure 11. Oxidative stress in degenerated SGNs was diminished by the CCI-779 intervention. (a-d) The western blot results revealed that compared with those in the blank control group, the levels of 3-NT, 4-HNE, and 8-OHdG in the degenerated SGNs were significantly increased throughout the process of SGN degeneration. (e and f) The immunohistochemical 4-HNE staining results were also consistent with the western blot results. Images were taken from the middle turn of cochlea. (g-k) The 3-NT, 4-HNE and 8-OHdG levels in the SGNs of the experimental group were much lower than those in the negative control group but were still higher than those in the blank control group based on western blot. *, the difference between the experimental group and the blank control group was significant (P < 0.05); #, the difference between the experimental group and the negative control group was significant (P < 0.05); CCI-779, experimental group; 30D, negative control group; Con, blank control group. Scale bar: 50 µm.
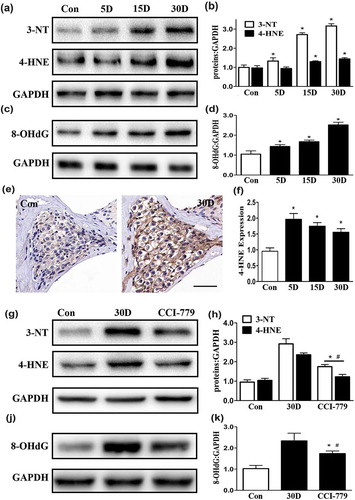
Table 1. Primers used for RT-PCR.