Figures & data
Figure 1. PRMT1 deficiency causes muscle loss and weakness. (a) Body weights from 6 months and 12 months-old control and prmt1 mKO mice (n = 8–10). Values represent the mean ± SD. *P < 0.05. (b) The relative mass of four muscle types divided by the body weight of control and prmt1 mKO mice. Values of control muscles were set to 1.0 (n = 8–10). (c) Immunostaining for MYH4 (Myh type IIb) and LAMA1 (laminin) in TA and EDL muscles from 6 months-old control and prmt1 mKO mice. Scale bar: 50 μm. (d) Quantification of the cross-sectional area of MYH4-positive myofibers in TA and EDL muscles of 6 months old mice. (n = 4). Data represent mean ± SEM. *P < 0.05, **P < 0.01, ***P < 0.001. (e and f) qRT-PCR analysis of TA muscles from 6-months-old control and prmt1 mKO mice. Data represent mean ±SD. *P < 0.05, **P < 0.01, ***P < 0.001 (n = 4). (g) Measurement of grip strength from 6-months-old mice (n = 8). Data represent mean ± SD. **P < 0.01. (h) Amplitude of electrical-triggered force by pacing designed to induce single twitch and tetanus (n = 4). Values represent the mean ± SD. *P < 0.05, **P < 0.01, ***P < 0.001.
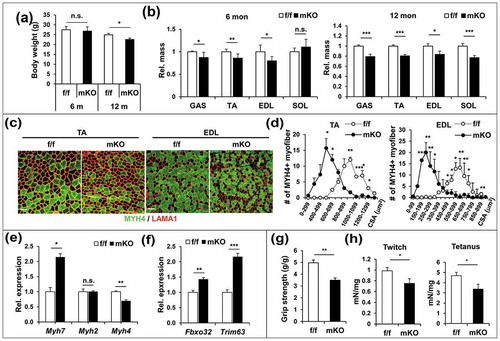
Figure 2. PRMT1-deficient muscles exhibit elevated catabolic pathways with increased autophagy. (a) Immunoblot analysis of fed, fast (16 h) or re-fed (6 h) TA muscles for expression of various regulators. (b) Quantification of the relative protein levels of p-AMPK, LC3-II and PRMT1. The intensity of p-AMPK, LC3-II and PRMT1 were normalized to total AMPK, LC3-I and TUBB/β-tubulin, respectively. The value of the fed state was set to 1.0 (n = 4). Data represent means ± SD. *P < 0.05, **P < 0.01, ***P < 0.001. (c) Immunoblot analysis of control and prmt1 mKO muscles treated with control or insulin (0.1 U/mouse) for 10 min (n = 3). (d) Quantification of the relative protein levels of p-AMPK, LC3-II and SQSTM1 from control and prmt1 mKO muscles without insulin treatment. The intensity of p-AMPK, LC3-II and SQSTM1 were normalized to total AMPK, LC3-I and TUBB, respectively. The value of control muscles was set to 1.0 (n = 3). Data represent means ± SD. *P < 0.05, ***P < 0.001. (e) Immunoblot analysis of C2C12 cells infected with adenoviruses for control RNAi (ad-control) or Prmt1 RNAi (ad-Prmt1i) at D3 for the expression of MHC, LC3 and TRIM63. Quantification of the relative protein levels of LC3-II. The intensities of LC3-II were normalized to LC3-I. Data represent means ± SD. *P < 0.05, **P < 0.01, ***P < 0.001. (f) Immunostaining for MHC in C2C12/ad-control or C2C12/ad-Prmt1i cells at D3. Scale bar: 50 μm. (g) Quantification of myotube diameter in C2C12/ad-control or C2C12/ad-Prmt1i cells at D3. Data represent means ± SD. *P < 0.05, **P < 0.01, ***P < 0.001. (h) C2C12/pcDNA-HA and C2C12/PRMT1-HA cells were starved in DMEM containing 2% HS for the indicated hours followed by immunoblot analysis for the indicated markers. (i–k) Immunoblot analysis and quantifications of LC3-II levels from C2C12/pcDNA-HA and C2C12/PRMT1-HA cells treated with or without 10 nM bafilomycin A1 for 3 h. (n = 3). Data represent means ± SD. *P < 0.05, **P < 0.01, ***P < 0.001.
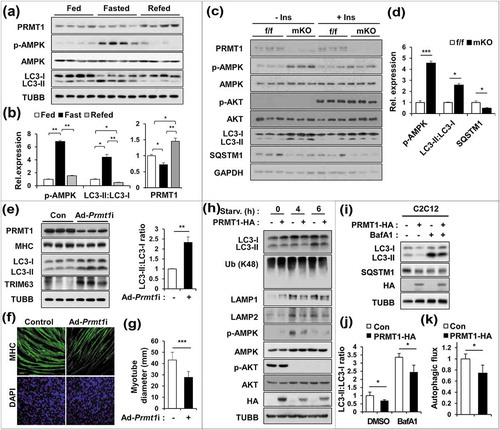
Figure 3. PRMT1 deficiency enhances the expression and activity of FOXO3 in skeletal muscle. (a) Immunoblot analysis of 6-months-old control and prmt1 mKO TA muscles for FOXO1 and FOXO3. Quantification of relative protein levels of FOXO3 and FOXO1. The intensities were normalized to GAPDH. Data represent means ± SD. **P < 0.01, n.s. = not significant. (b) qRT-PCR analysis of Foxo1 and Foxo3 levels in 6-months-old control and prmt1 mKO TA muscles (n = 4). (c) Representative images of immunostaining for FOXO3 (green) and DES (red) with TA sections from 6-months-old control and prmt1 mKO mice. Scale bar: 20 μm. (d) Nuclear fractionation of C2C12/ad-control and C2C12/ad-Prmt1i cells. (e) Quantification of the relative amounts of nuclear FOXO3 and FOXO1 protein levels. The intensities were normalized to LMNB1. Data represent means ± SD. *P < 0.05, **P < 0.01, ***P < 0.001. (f) qRT-PCR analysis of Prmt1, Foxo3 and Trim63 levels in C2C12/ad-control and C2C12/ad-Prmt1i cells at D3 (n = 4). Data represent means ± SD. *P < 0.05, **P < 0.01, ***P < 0.001.
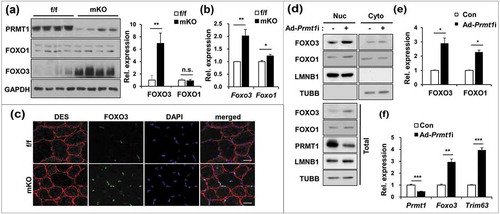
Figure 4. PRMT1 suppresses PRMT6 in skeletal muscle and myoblasts. (a) qRT-PCR analysis of PRMTs levels from 2-months-old control and prmt1 mKO TA muscles. (n = 4) (b) Immunoblot analysis for PRMT1 and PRMT6 protein expression in control and prmt1 mKO TA muscles. (c) Quantification of relative protein levels of PRMT4 and PRMT6. The intensities were normalized to GAPDH (n = 4). Data represent means ± SD. *P < 0.05, **P < 0.01, ***P < 0.001. (d) Immunostaining for PRMT6 (green) and DAPI (blue) from 6-months-old TA muscles. Scale bar: 20 μm. (e) Immunoblot analysis of PRMT1, PRMT6 and TRIM63 expression in control and prmt1 knockout C2C12 cells at D3. (f) qRT-PCR analysis of Prmt6 levels in C2C12/ad-control or C2C12/ad-Prmt1i cells at D3. Data represent means ± SD. *P < 0.05, **P < 0.01, ***P < 0.001. (g) qRT-PCR analysis of Prmt6 levels in C2C12/pcDNA-HA or C2C12/PRMT1-HA cells at D3. Data represent means ± SD. *P < 0.05, **P < 0.01, ***P < 0.001. (h) Chromatin-immunoprecipitation (ChIP) assay of Prmt6 promoter region from +752 to −82 in C2C12/ad-control and C2C12/ad-Prmt1i cells at D3. Values are means of triplicate determinants ± SD. *P< 0.05, **<0.01, ***<0.001. (i) Immunoblot analysis for indicated markers in C2C12/ad-control and C2C12/ad-Prmt1i cells at D3.
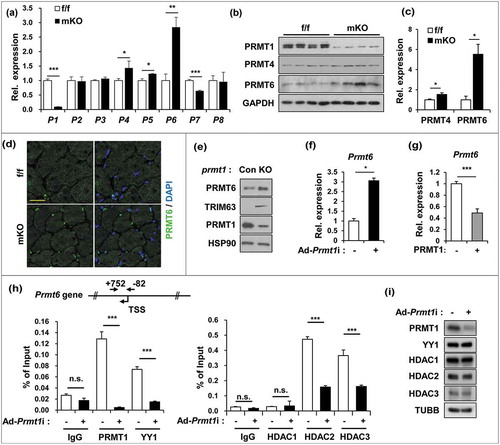
Figure 5. PRMT1 inhibits FOXO3 through PRMT6 suppression. (a) Cellular fractionation of control or prmt1-knockout C2C12 cells followed by immunoblot analysis with the indicated markers. (b) Luciferase assay of C2C12 cells cotransfected with FOXO3-reporter, control or FOXO3 and control, PRMT1 or PRMT6 expression vectors. Data represent means ± SD. Letters indicate statistically distinct group (one-way ANOVA<0.01). (c) Cellular fractionation of C2C12 cells at D1 transfected with pcDNA-HA or a plasmid encoding PRMT6-HA followed by immunoblot analysis for the indicated markers. (d) C2C12/pcDNA-HA and C2C12/PRMT6-HA cells were incubated in DMEM containing 2% HS for the indicated hours followed by immunoblot analysis for the indicated markers. (e–g) Immunoblot analysis and quantifications of LC3-ll levels from C2C12/ad-control and C2C12/ad-Prmt6i cells treated with or without 10 nM Baf A1 for 3 h. (n = 3). Data represent means ± SD. *P < 0.05, **P < 0.01, ***P < 0.001.
Figure 6. PRMT6 methylates FOXO3 on arginine 188 and 249 critical for its activity. (a) Lysates of 10T1/2 mouse embryonic fibroblasts incubated with DMEM containing 0.1% FBS for the indicated hours were subjected to immunoprecipitation with FOXO3 antibodies and immunoblot analysis with indicated antibodies. (b) Co-immunoprecipitation of control, PRMT1-HA or PRMT6-HA and control or FOXO3-flag transfected 293T cells with flag antibodies and immunoblot analysis with indicated antibodies. (c) Coimmunoprecipitation from 293T cells transiently expressing control, PRMT6 WT or PRMT6V86K,D88A mutant and control or FOXO3-HA proteins. Anti-HA immunoprecipitates were analyzed by immunoblotting analysis via indicated antibodies. (d) Luciferase assay of C2C12 cells cotransfected with FOXO3-reporter, FOXO3 and PRMT6 WT or PRMT6V86K/D88A mutant. Data represent means ± SD. Letter indicate statistically distinct group (One way ANOVA, P < 0.01). (e) qRT-PCR analysis for the expression of Fbxo32 and Trim63 in FOXO3 and PRMT6 WT or PRMT6V86K,D88A transfected C2C12 cells at D3. Data represent means ± SD. Letters indicate statistically distinct groups (one-way ANOVA, P < 0.01). (f) Coimmunoprecipitation of PRMT6-HA and flag-tagged FOXO3 WT, R188K, R218K or R249K transiently transfected 293T cells with flag antibodies and immunoblot analysis with the indicated antibodies. (g) qRT-PCR analysis for the expression of Fbxo32 and Trim63 in FOXO3 WT or R188K, R218K or R249K transfected C2C12 cells at D3. Data represent means ± SD. Letter indicate statistically distinct group (One way ANOVA, P < 0.01). (h) Cellular fractionation of C2C12 cells at D3 transfected with flag-tagged pcDNA, FOXO3 WT, R188K, R218K or R249K followed by immunoblot analysis for the indicated markers. (i) Luciferase assay with C2C12/ad-control or C2C12/ad-Prmt1i cells cotransfected with FOXO3-reporter, control or FOXO3 and treated with vehicle or 10 μM EPZ020411 for 24 h. Data represent means ± SD. Letters indicate statistically distinct groups (One way ANOVA, P < 0.01). (j) Control or prmt1-knockout C2C12 cells were transduced by ad-control or ad-Prmt6i and cultured for 3 days, followed by cellular fractionation and immunoblotting. (k) qRT-PCR analysis for the expression of Foxo3, Trim63 and Fbxo32 in C2C12 cells at D3. Data represent means ± SD. Letter indicate statistically distinct group (One way ANOVA, P < 0.01).